Google Analytics metrics are quantitative measurements of data. For example, the “Users” metric shows the number of users that visited your website in a given time frame.

That’s not the only metric Google Analytics measures:
- Sessions
- Bounce rate
- New users
- Page views
- Avg. session duration
- Pages per session
- Conversion rate
Metrics—along with dimensions—make up every report in Google Analytics. Here’s how metrics and dimensions differ:
Metrics vs. Dimensions in Google Analytics
Dimensions are the attributes of your data.
While metrics are expressed numerically, dimensions are expressed in non-numerical values.
For example, the dimension “Country” indicates where traffic originates from.
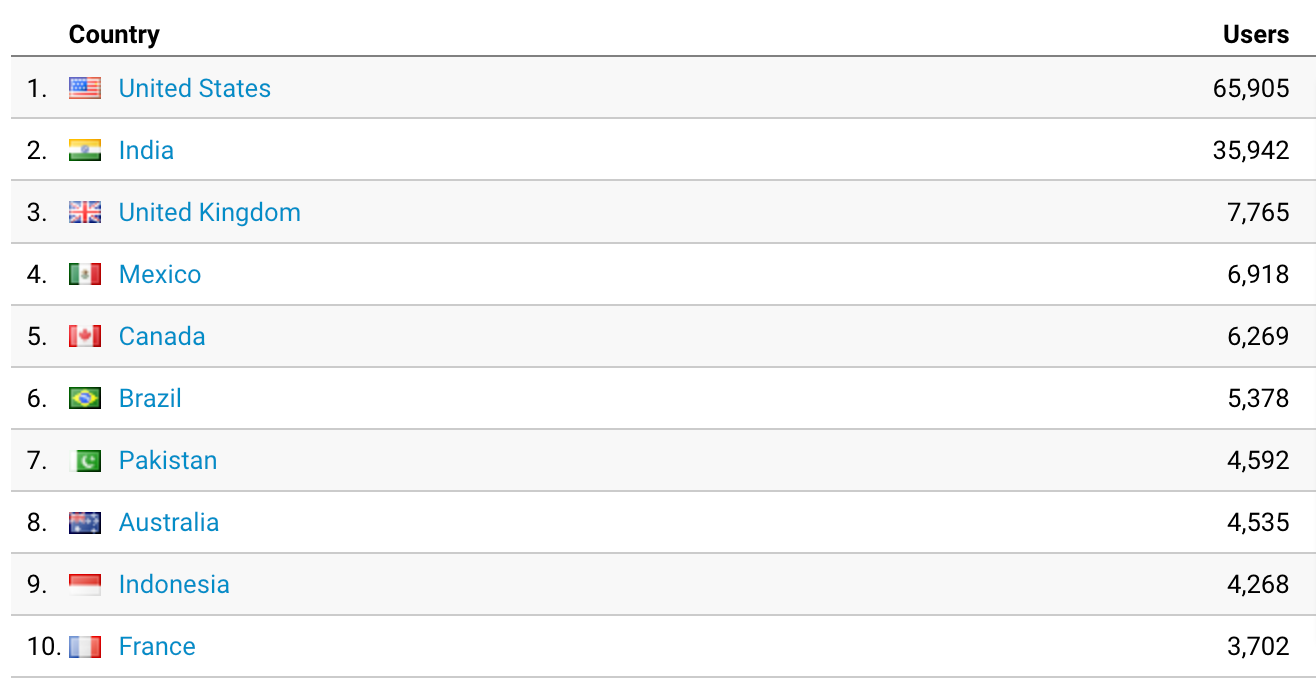
Or you could use the dimension “Device Category” to find out which devices visitors browse your website on.
Other Google Analytics dimensions include the following:
- Language
- Source/Medium
- Browser
- Campaign
- Page
We’ll focus on metrics for this post. But you can read our guide to dimensions in Google Analytics for more information.
Useful Metrics in Google Analytics
1. Number of Users
The “Users” metric represents the number of people who visit your website.
One user represents one website visitor.
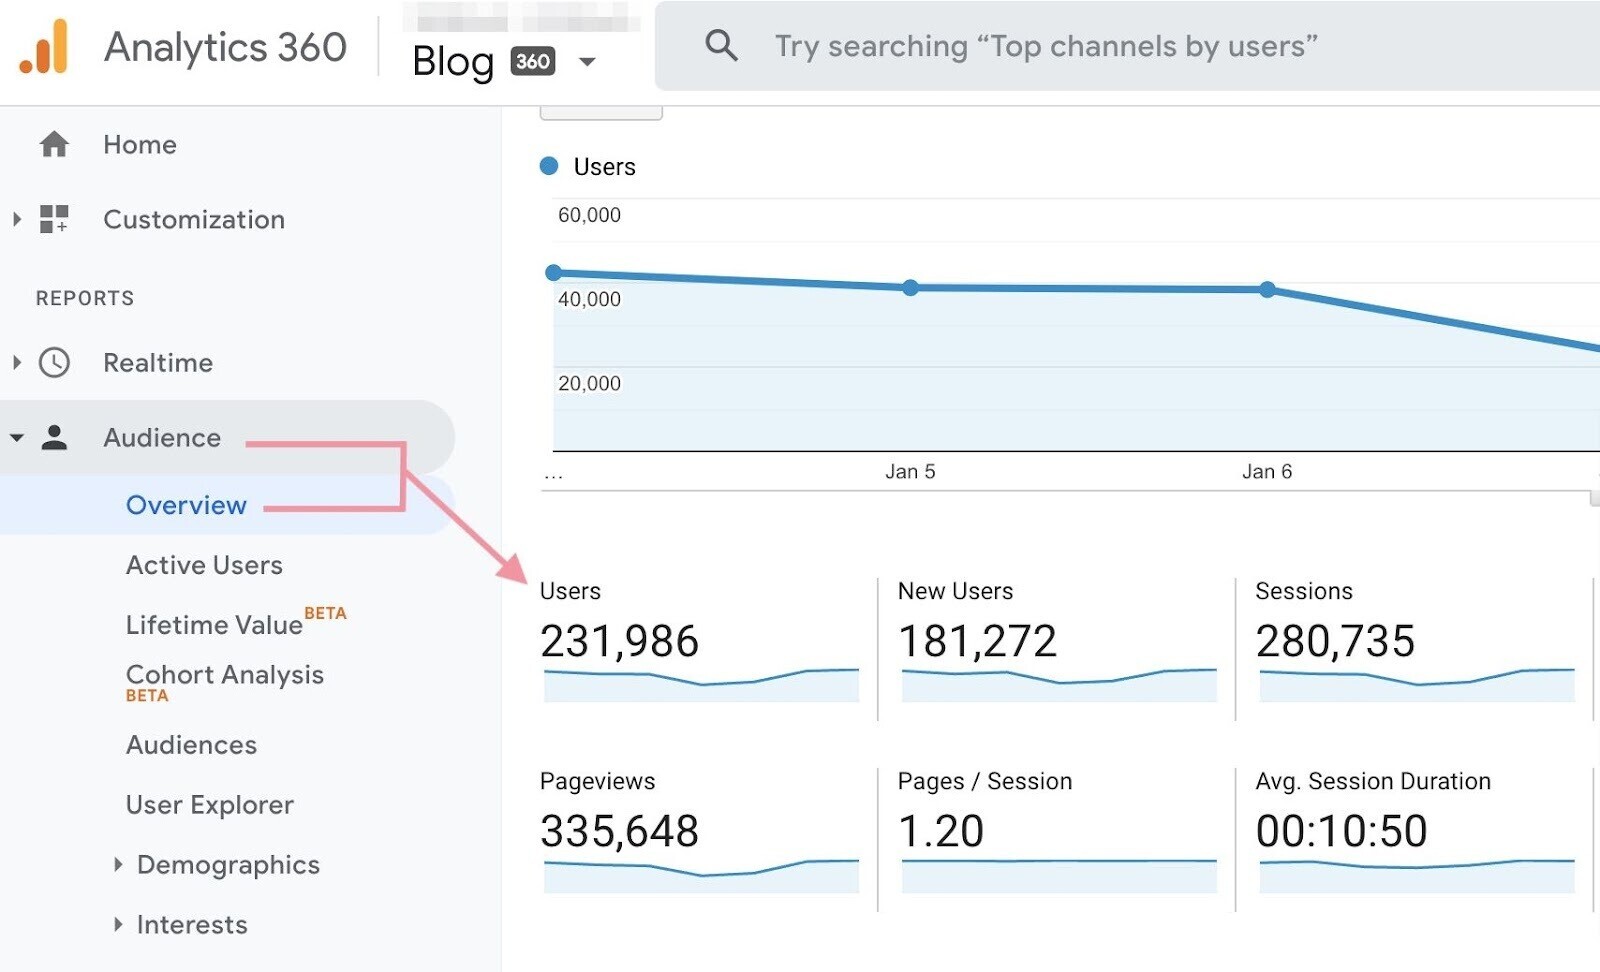
If you’re using a Universal Analytics (UA) account, you can view your user data by navigating to “Audience” > “Overview” from the navigation sidebar.
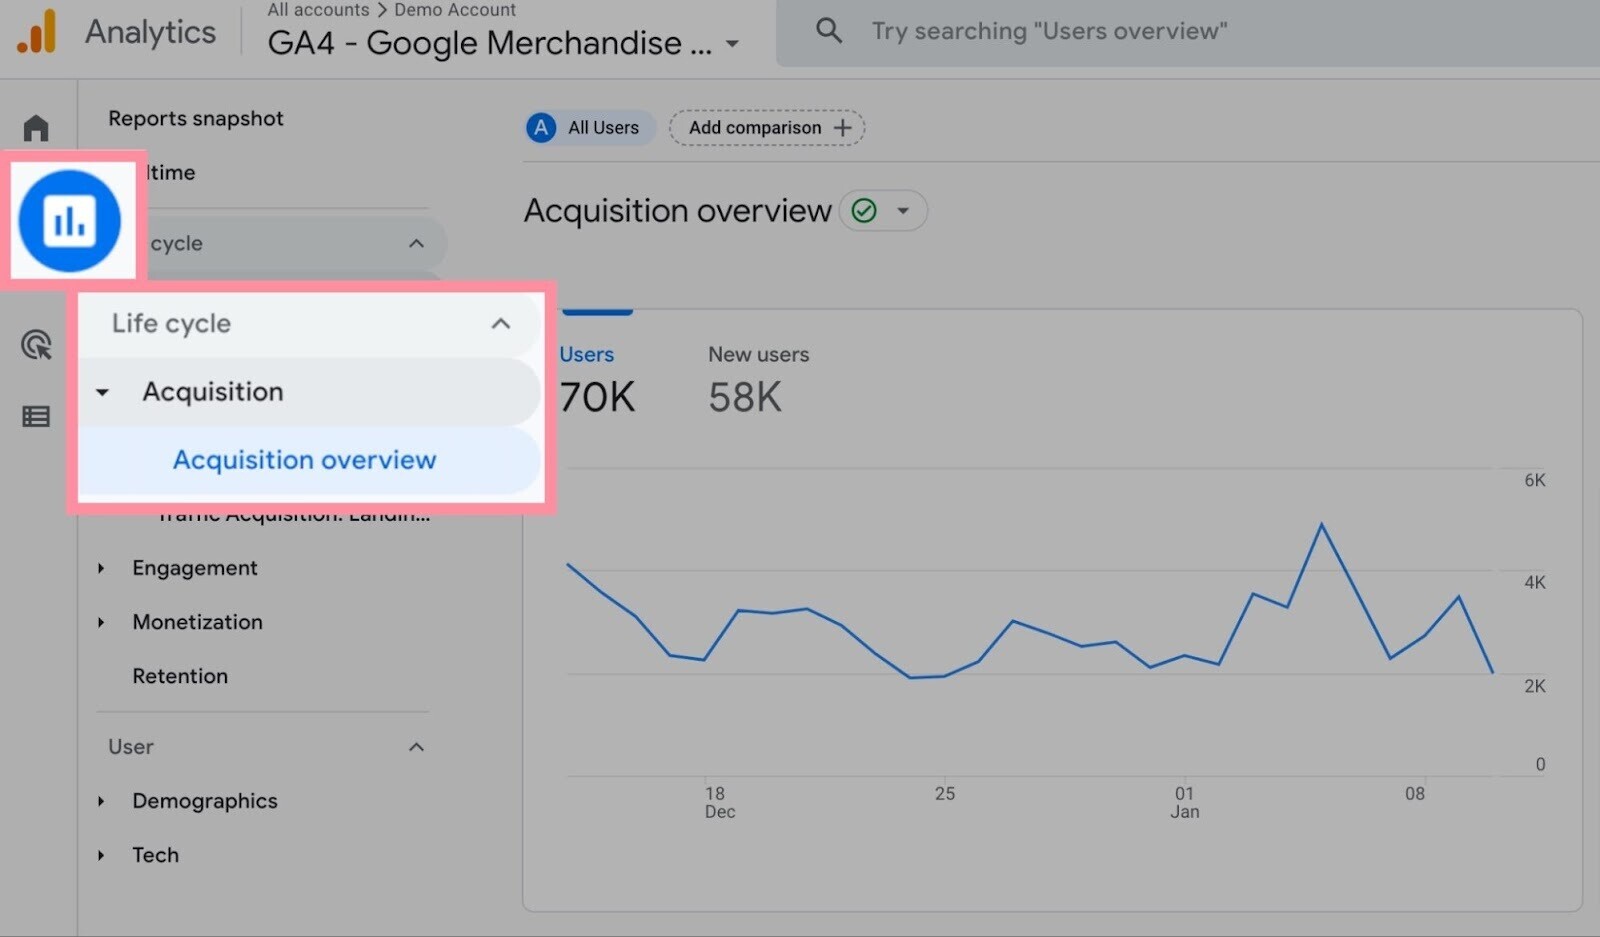
If you’ve already switched to Google Analytics 4 (GA4), you can view your user data by going to “Reports” > “Life cycle” > “Acquisition” > “Acquisition overview.”
In both Universal Analytics and GA4, you will see the users metric in other reports, too.
2. Number of Sessions
A session refers to a set of actions from one user that occur within a set time frame.
Say a user visited two pages, trigged two events, interacted with a social element, and completed a transaction. That would be one session.
Google views it like this:

In Universal Analytics, a session restarts after 30 minutes of inactivity or after midnight. As a result, a single user can have several sessions.
Note: In GA4, a session doesn’t restart after midnight. Only after 30 minutes of inactivity.
You can view users’ session data in the “Audience” > “Overview” section of your Universal Analytics account.
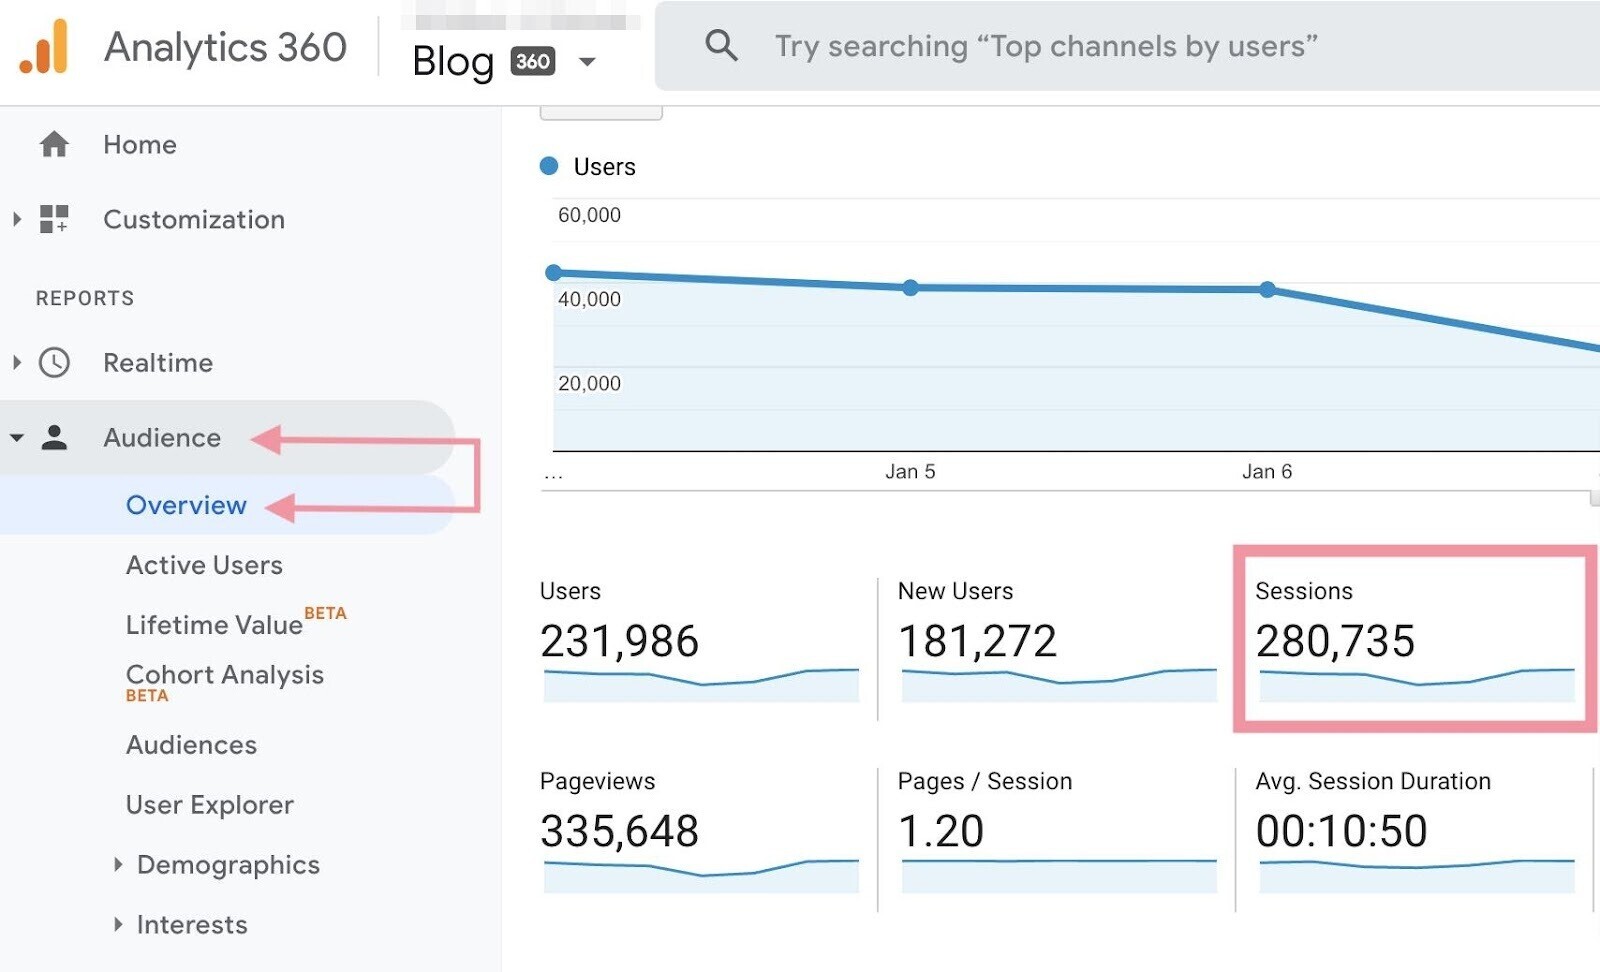
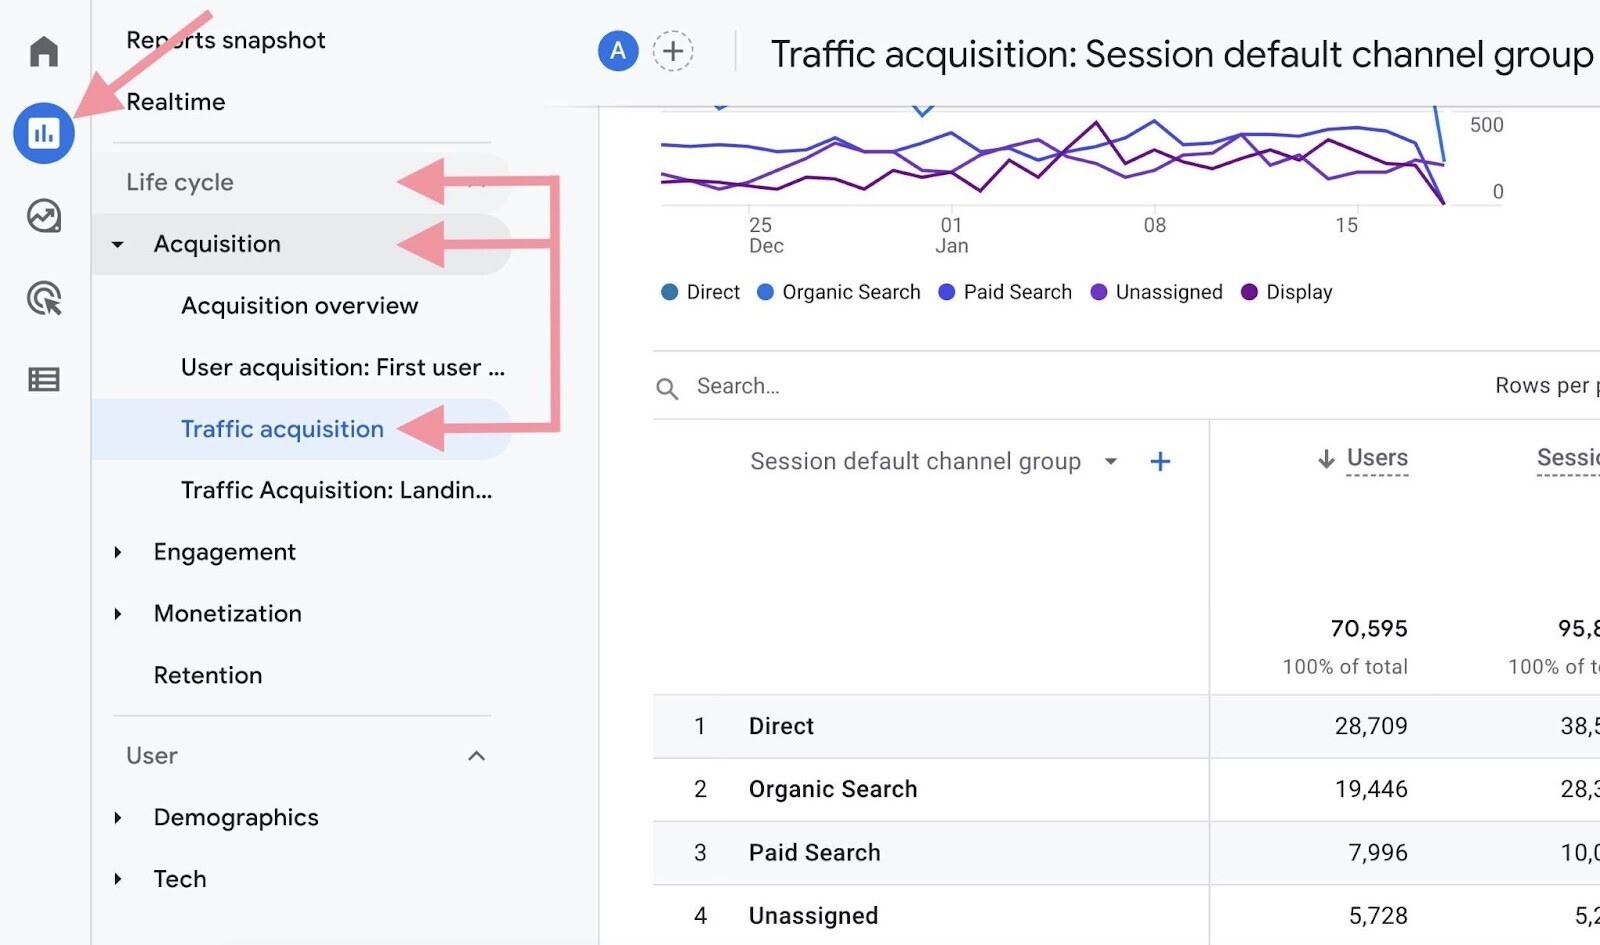
If you’re using GA4, view sessions data by navigating to “Reports” > “Life cycle” > “Acquisition” > “Traffic acquisition.”
3. New Users
The “New Users” Google Analytics metric tracks users who land on your website for the first time (based on browser cookies).
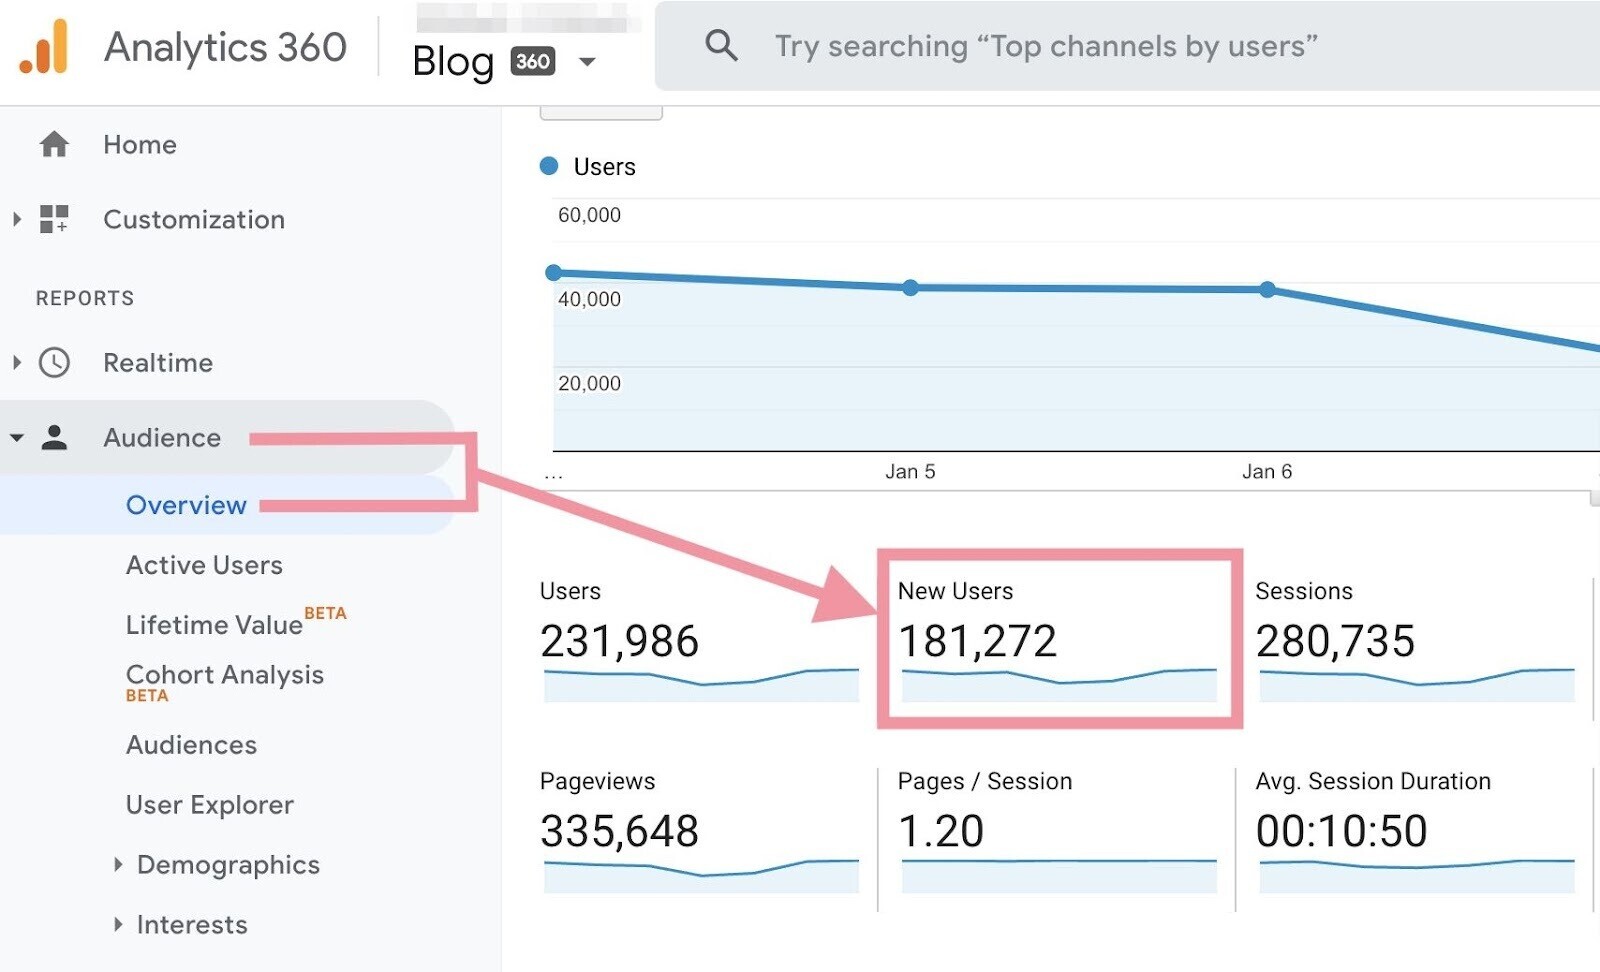
You can see your new users in the “Audience” > “Overview” section of Universal Analytics.
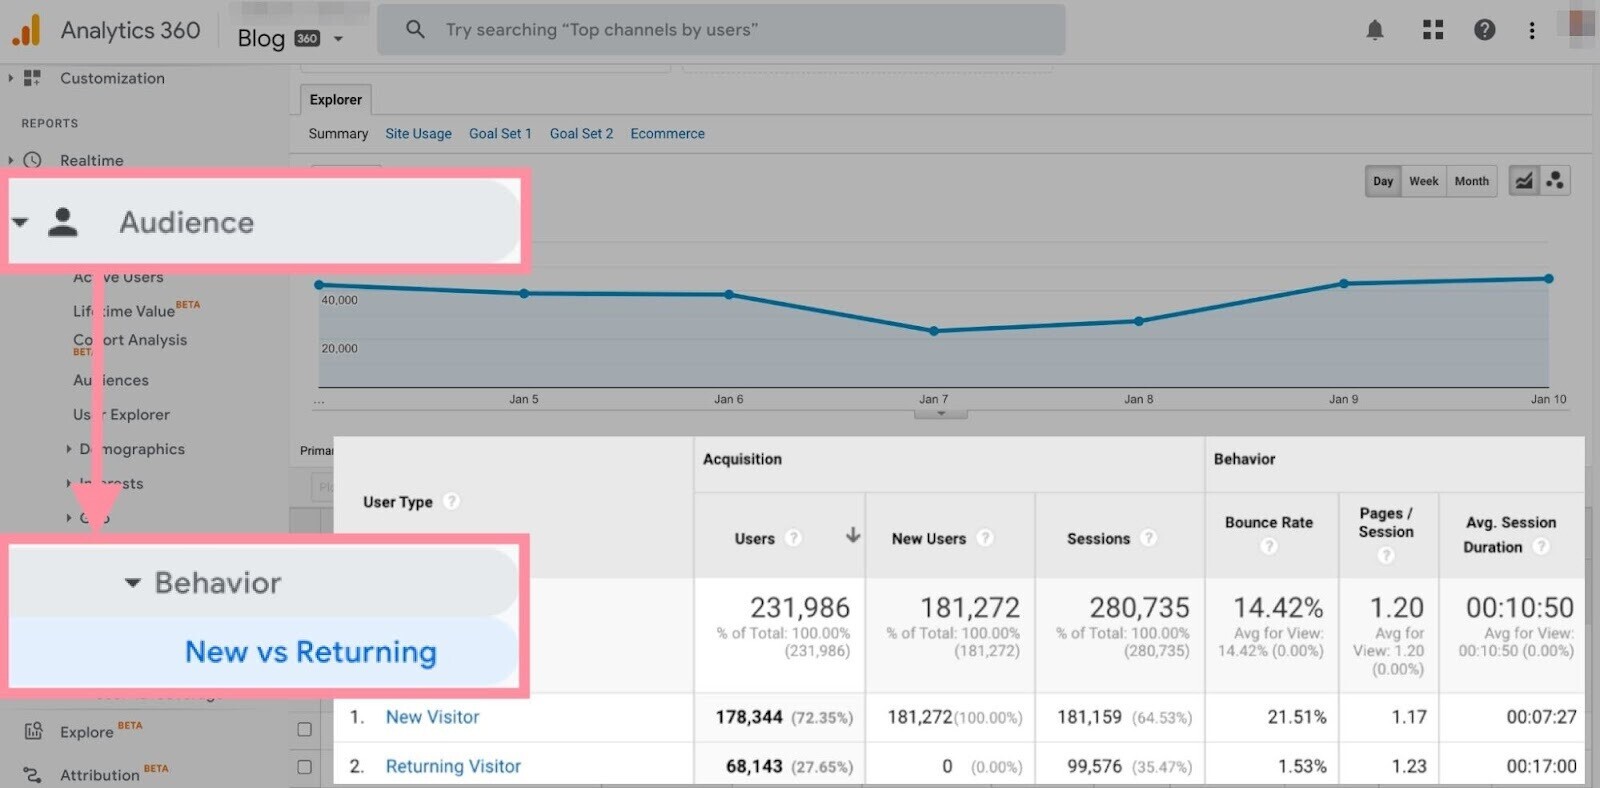
For more details on your new and returning visitors, go to the “New vs Returning” report under “Audience” > “Behavior.”
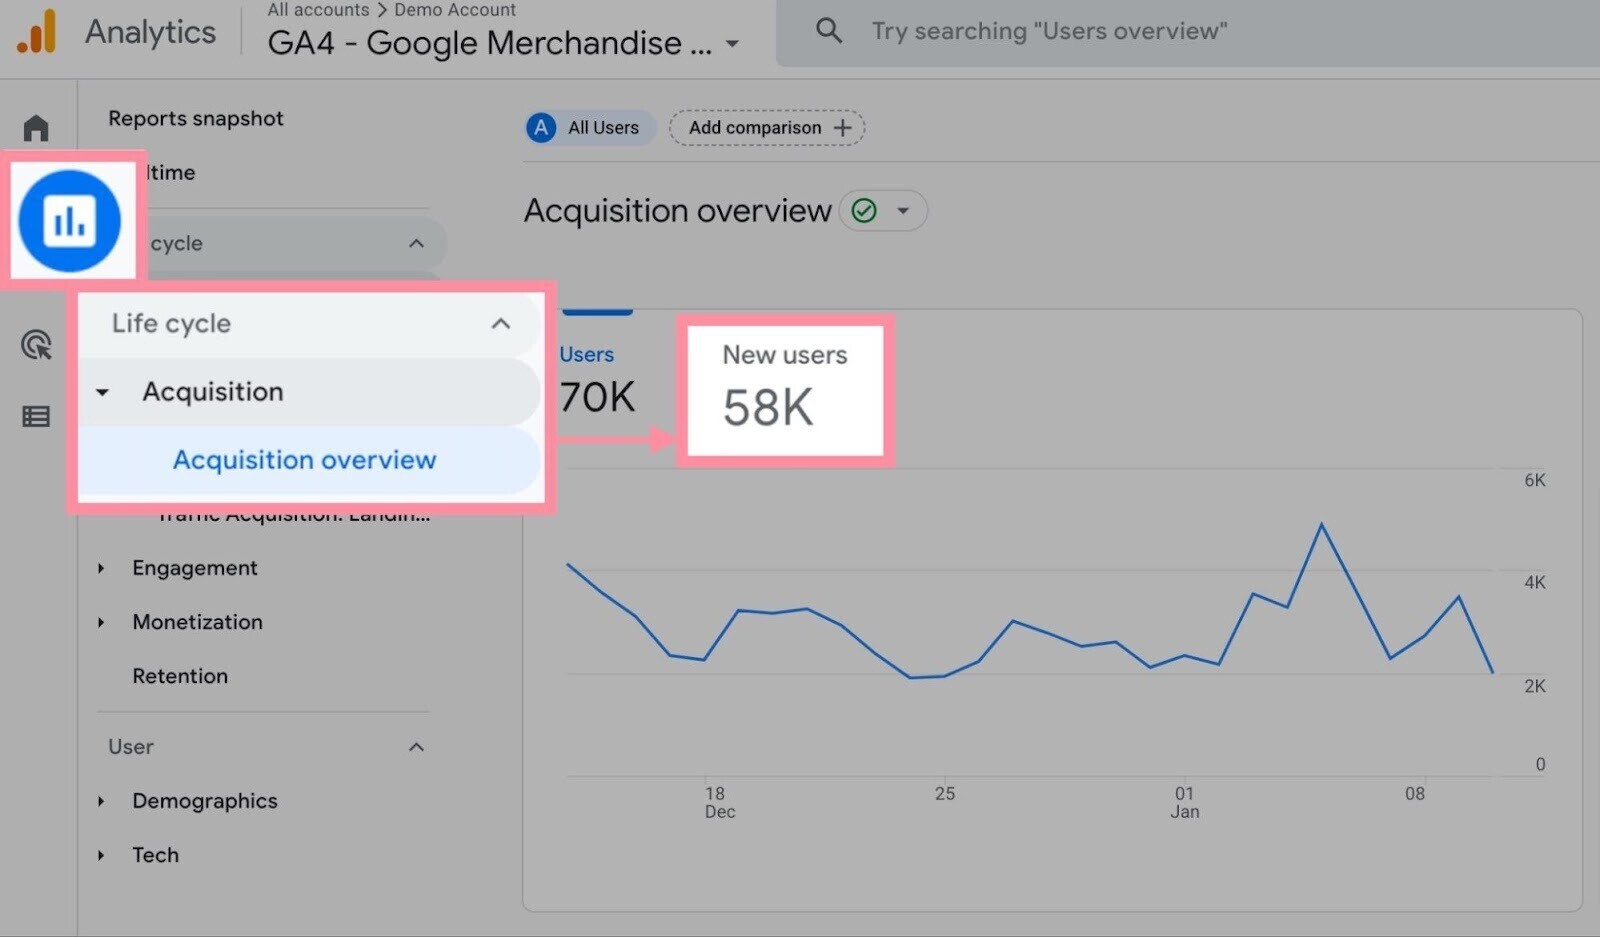
In GA4, you can see your new users by going to “Reports” > “Life cycle” > “Acquisition” > “Acquisition overview.”
4. Average Time on Page
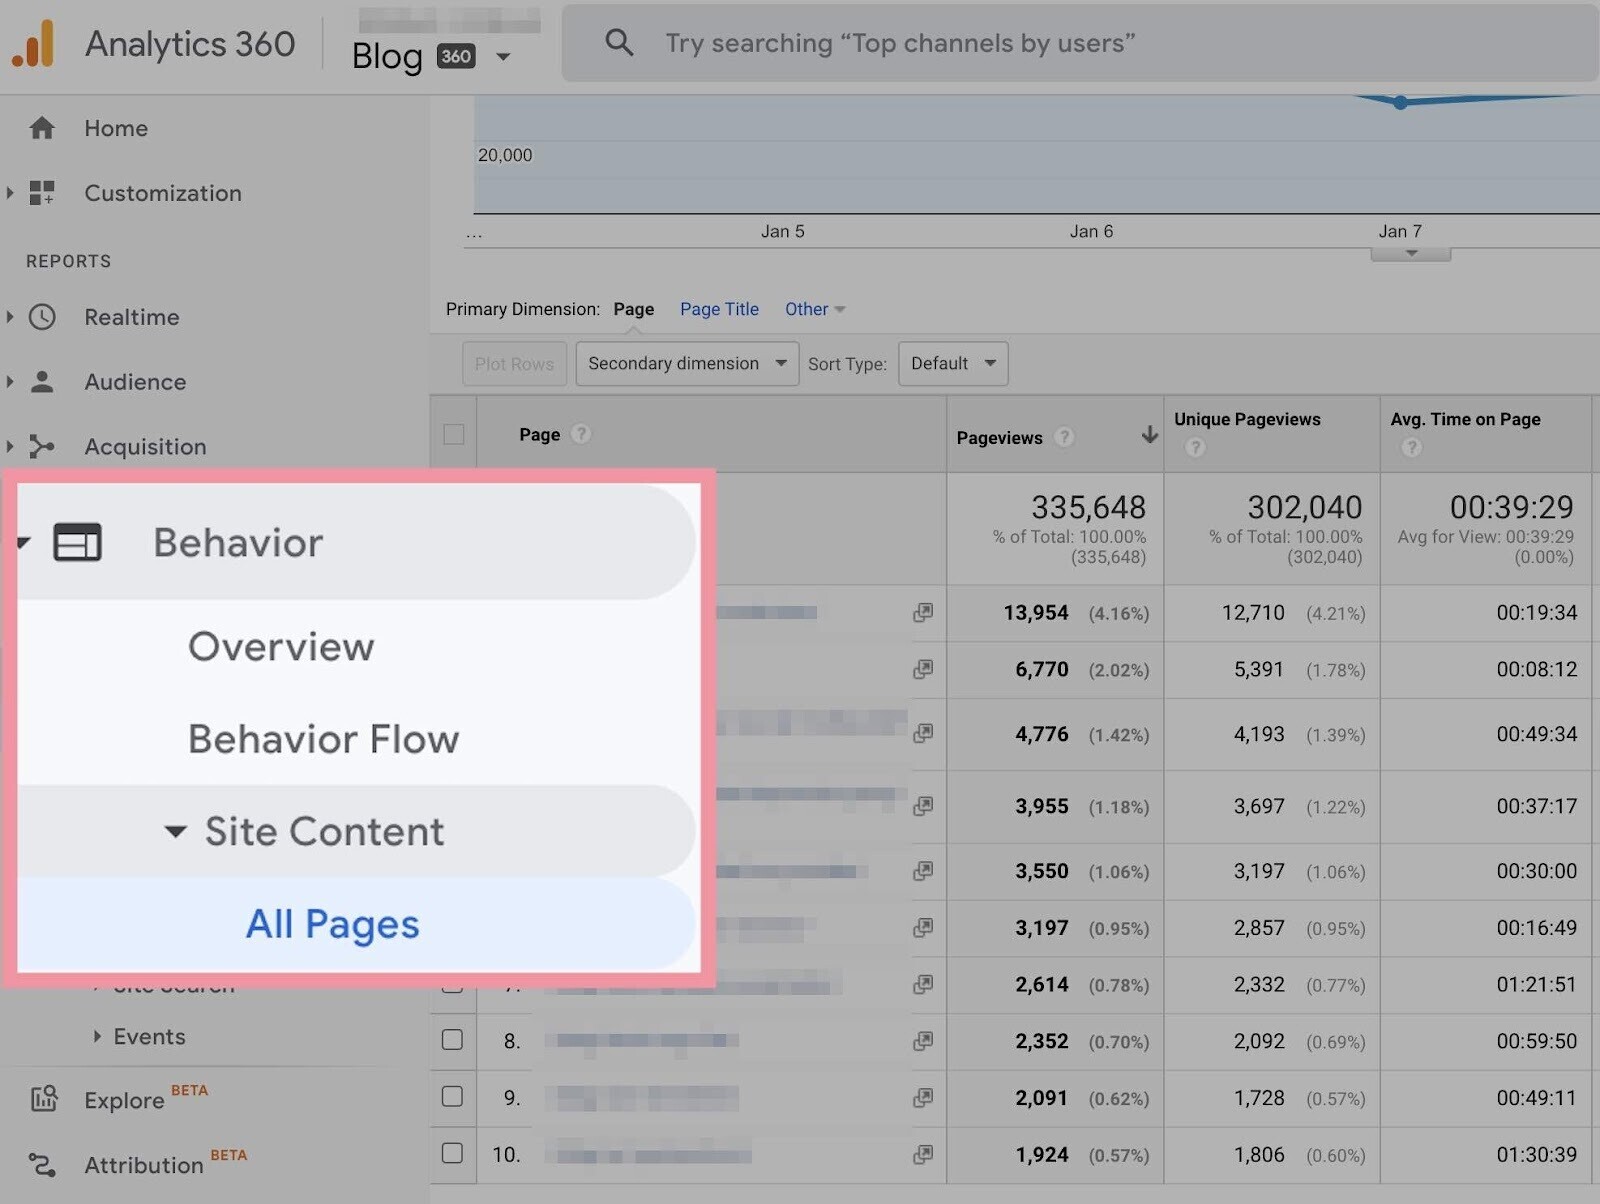
“Avg. Time on Page” measures the average amount of time people spend on a specific webpage.
Tracking time on page can help you determine whether users are engaged with your site.
View time on page in Universal Analytics by clicking “Behavior” > “Site Content” > “All Pages.”
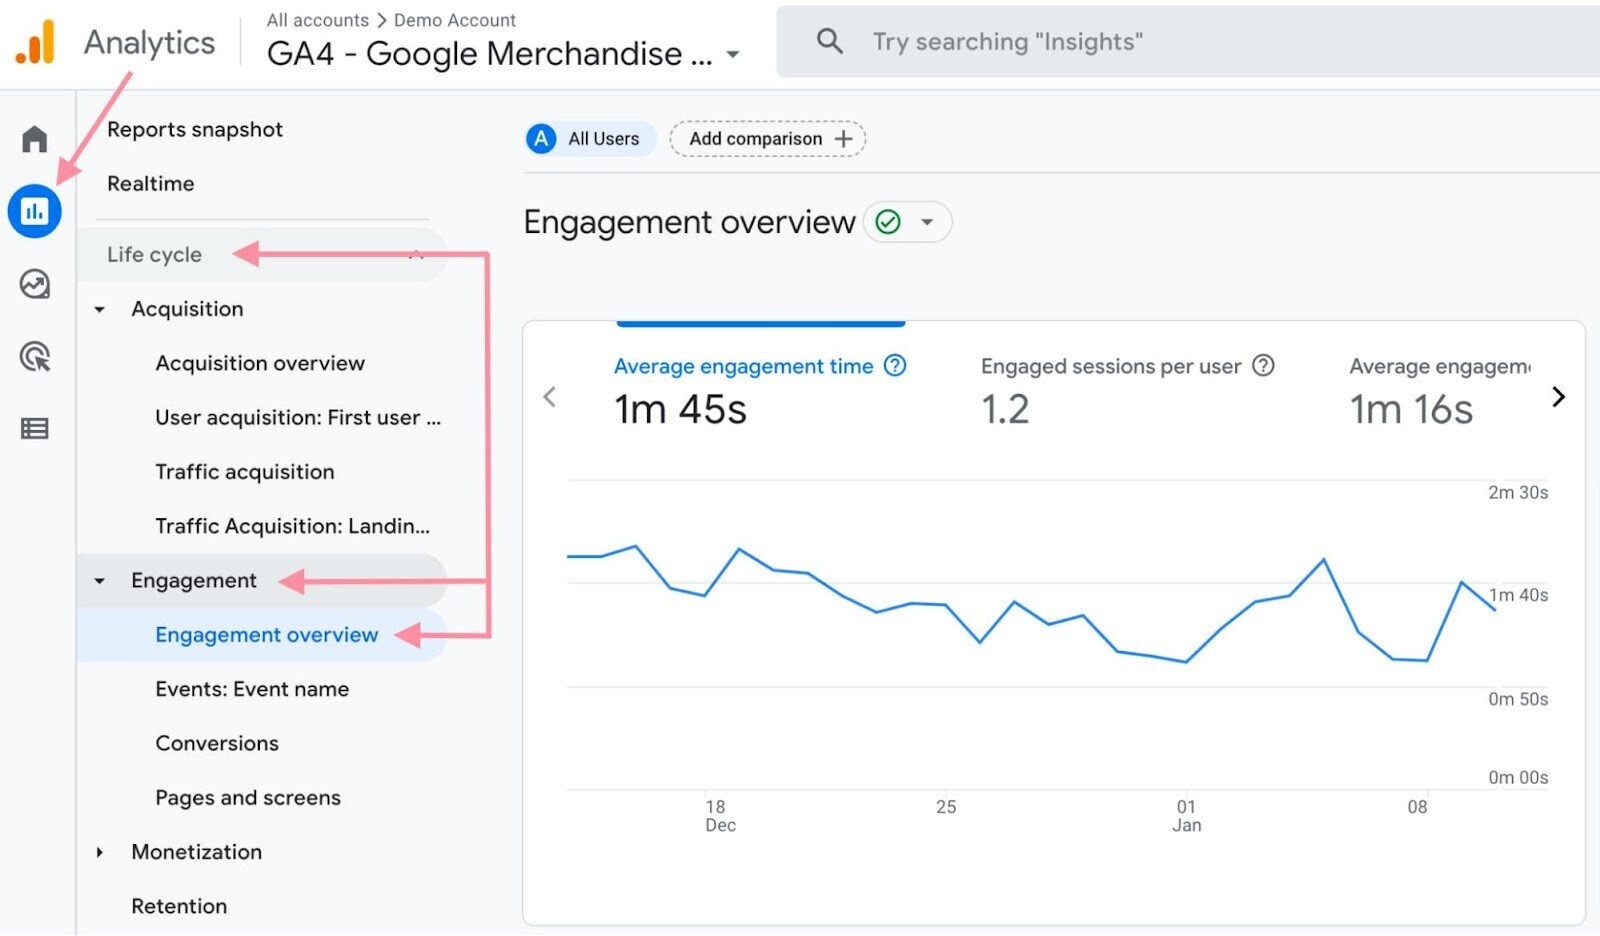
In GA4, Google replaced the “Avg. Time on Page” metric with a new metric called “Average Engagement Time.”
“Average Engagement Time” differs slightly from “Avg. Time on Page.” Because GA4 defines “user engagement” as “the time that your app screen was in the foreground or your webpage was in focus.”
To see the average engagement time for your site, go to “Reports” > “Life cycle” > “Engagement” > “Engagement overview.”
5. Average Pages Per Session
“Pages / Session” tells you the average number of pages your visitors browse during a session.
This metric gives you an idea about how users engage with your site. Or if there are any issues in the user journey. Lower numbers could indicate a user experience problem.
Find the average pages per session by clicking “Audience” > “Overview” in the navigation sidebar.
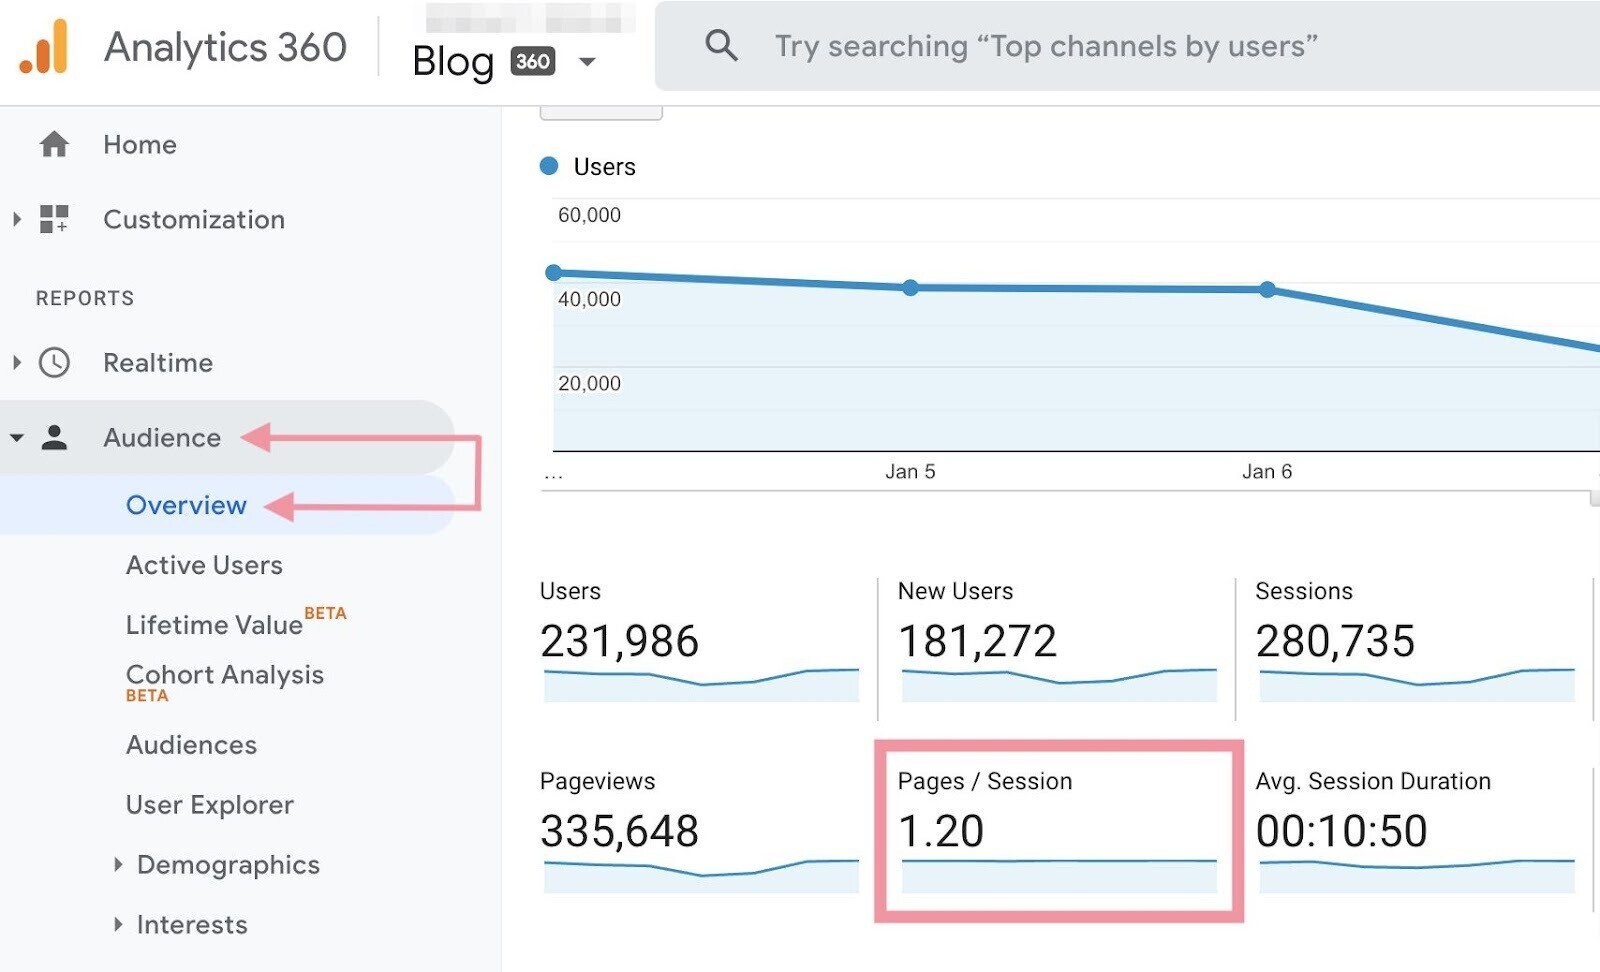
Google retired this metric in GA4. So you won’t find “Pages / Session” in GA4 properties.
6. Bounce Rate
Bounce rate is the percentage of users who land on your page and leave without taking any further action.
Like clicking on another page, subscribing to a newsletter, filling out a contact form, etc.
You can view your site’s bounce rate under the “Audience” > “Overview” report in Universal Analytics.
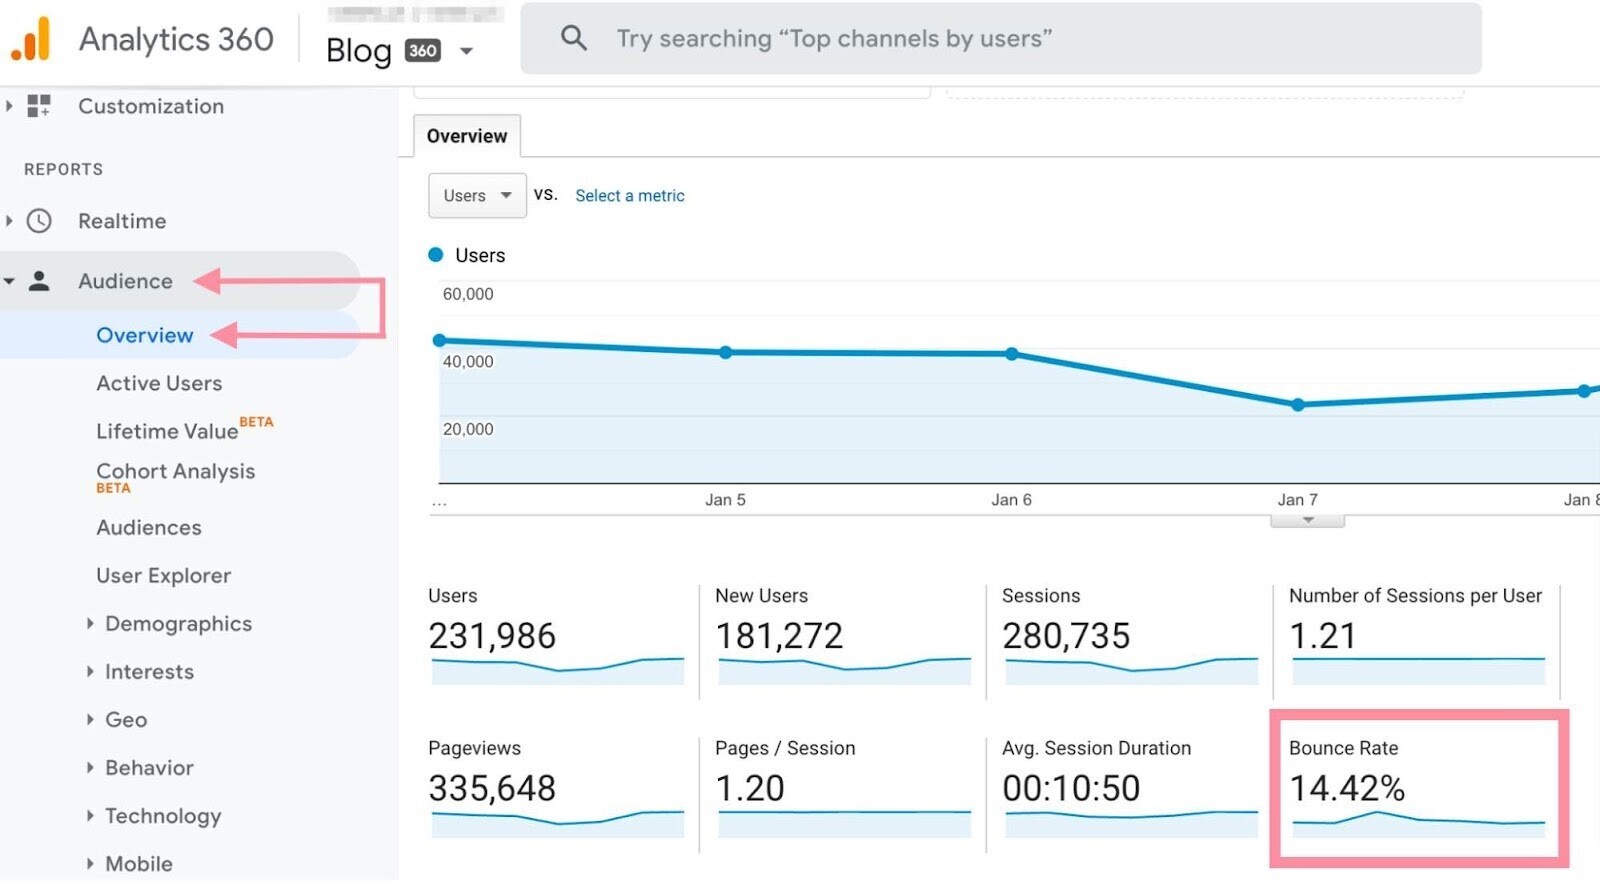
GA4 calculates bounce rate a bit differently. In GA4, bounce rate is based on the percentage of non-engaged sessions.
A non-engaged session is one where a user leaves your website in less than 10 seconds. Without triggering any event or clicking through to other pages.
So if a user stays on your page for more than 10 seconds, the session does not count as a bounce.
Even if a user performs no further action like clicking on another page or filling out a form.
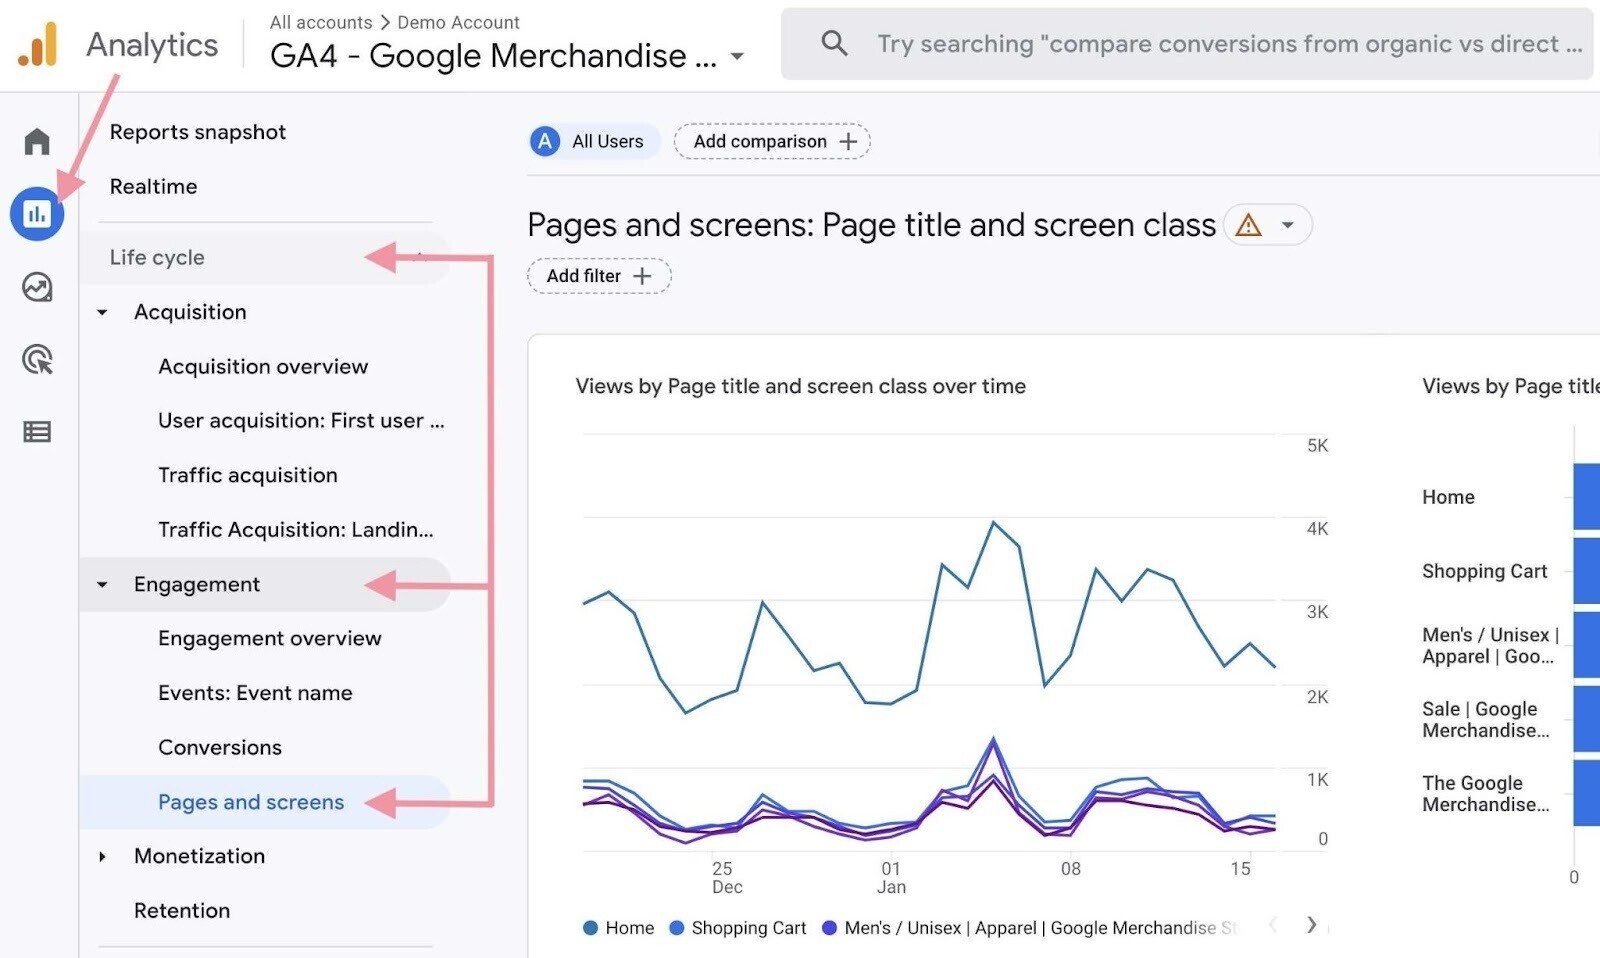
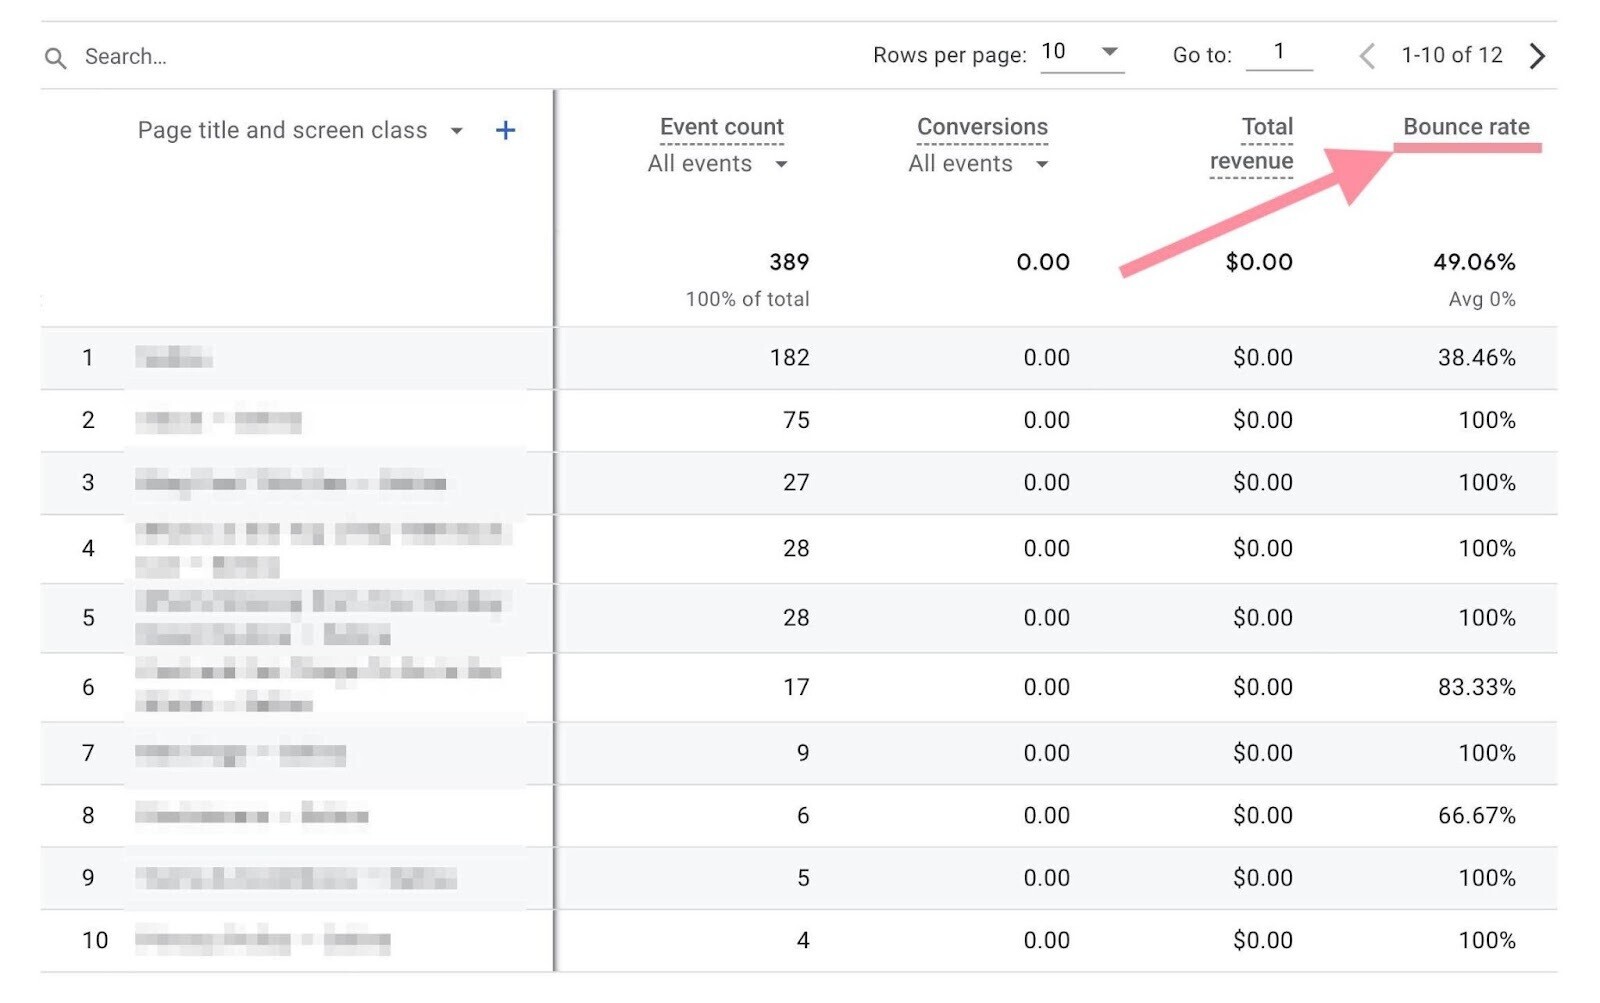
To see your bounce rate in GA4, you’ll need to customize your “Pages and screens” report.
Go to “Reports” > “Life cycle” > “Engagement” > “Pages and screens.”
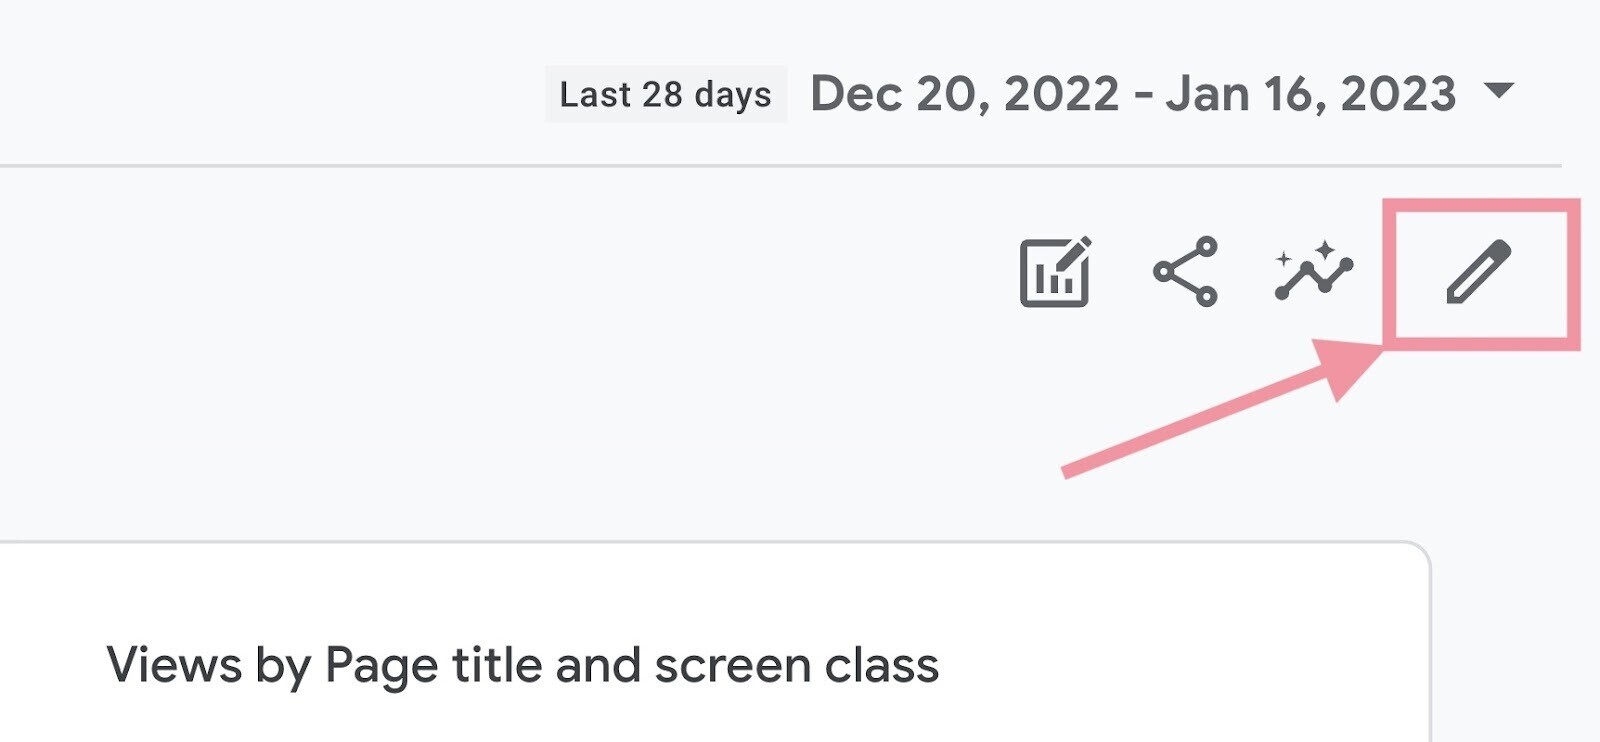
In the top right of your screen, click the pencil icon to customize your report.
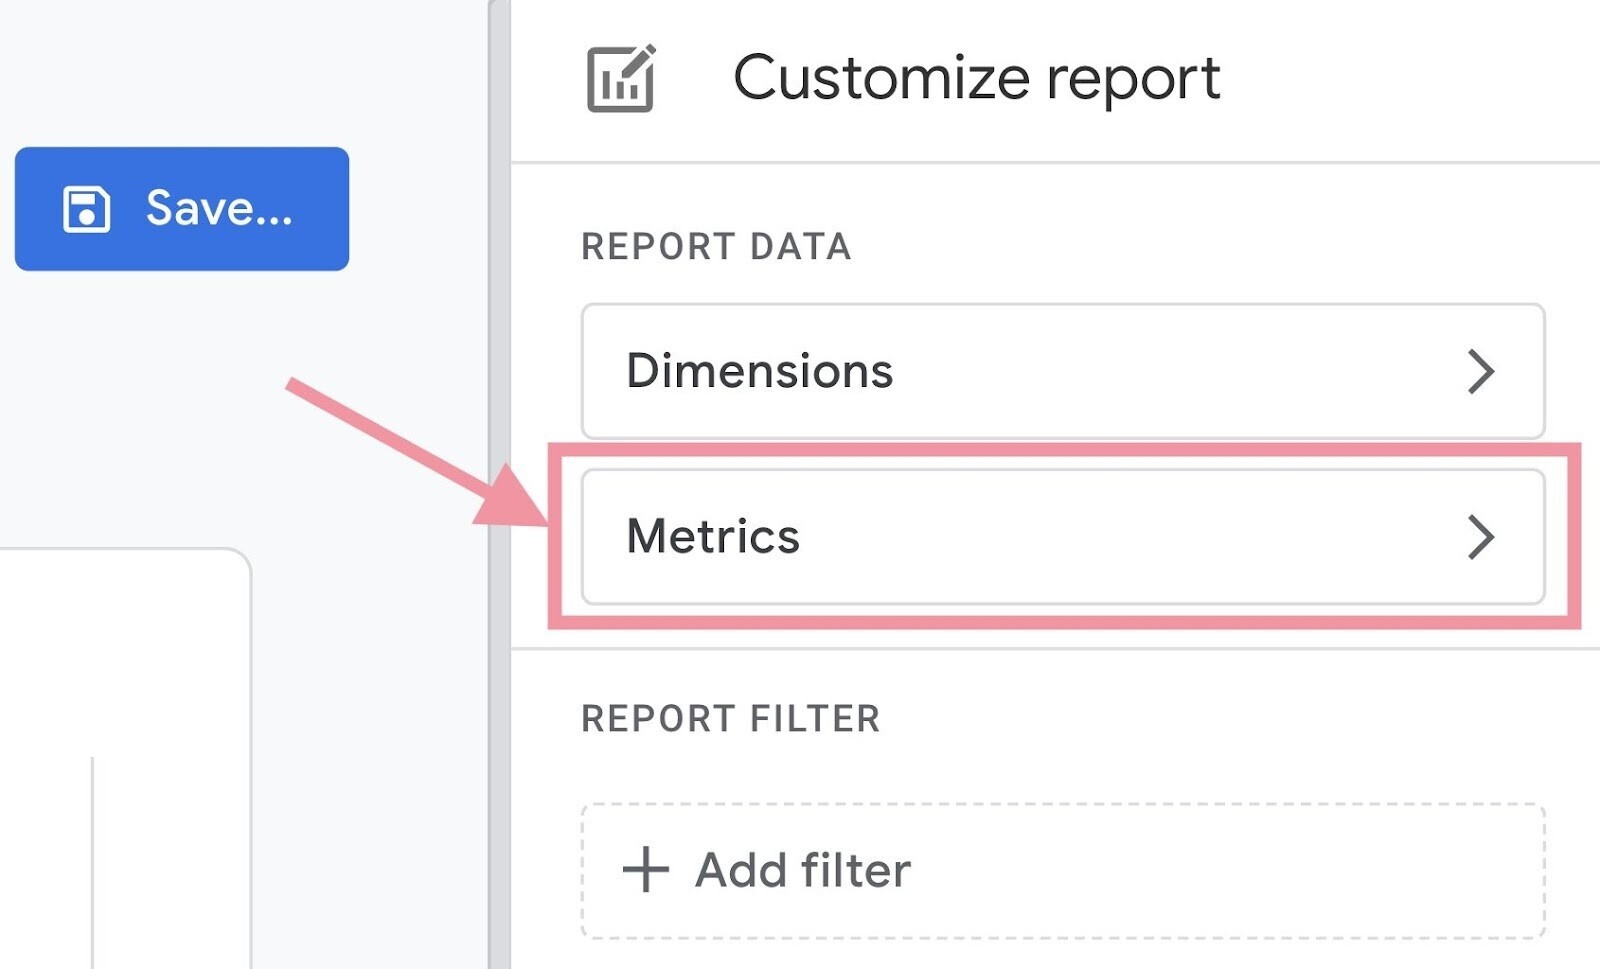
Choose “Metrics” from the “Report Data” section.
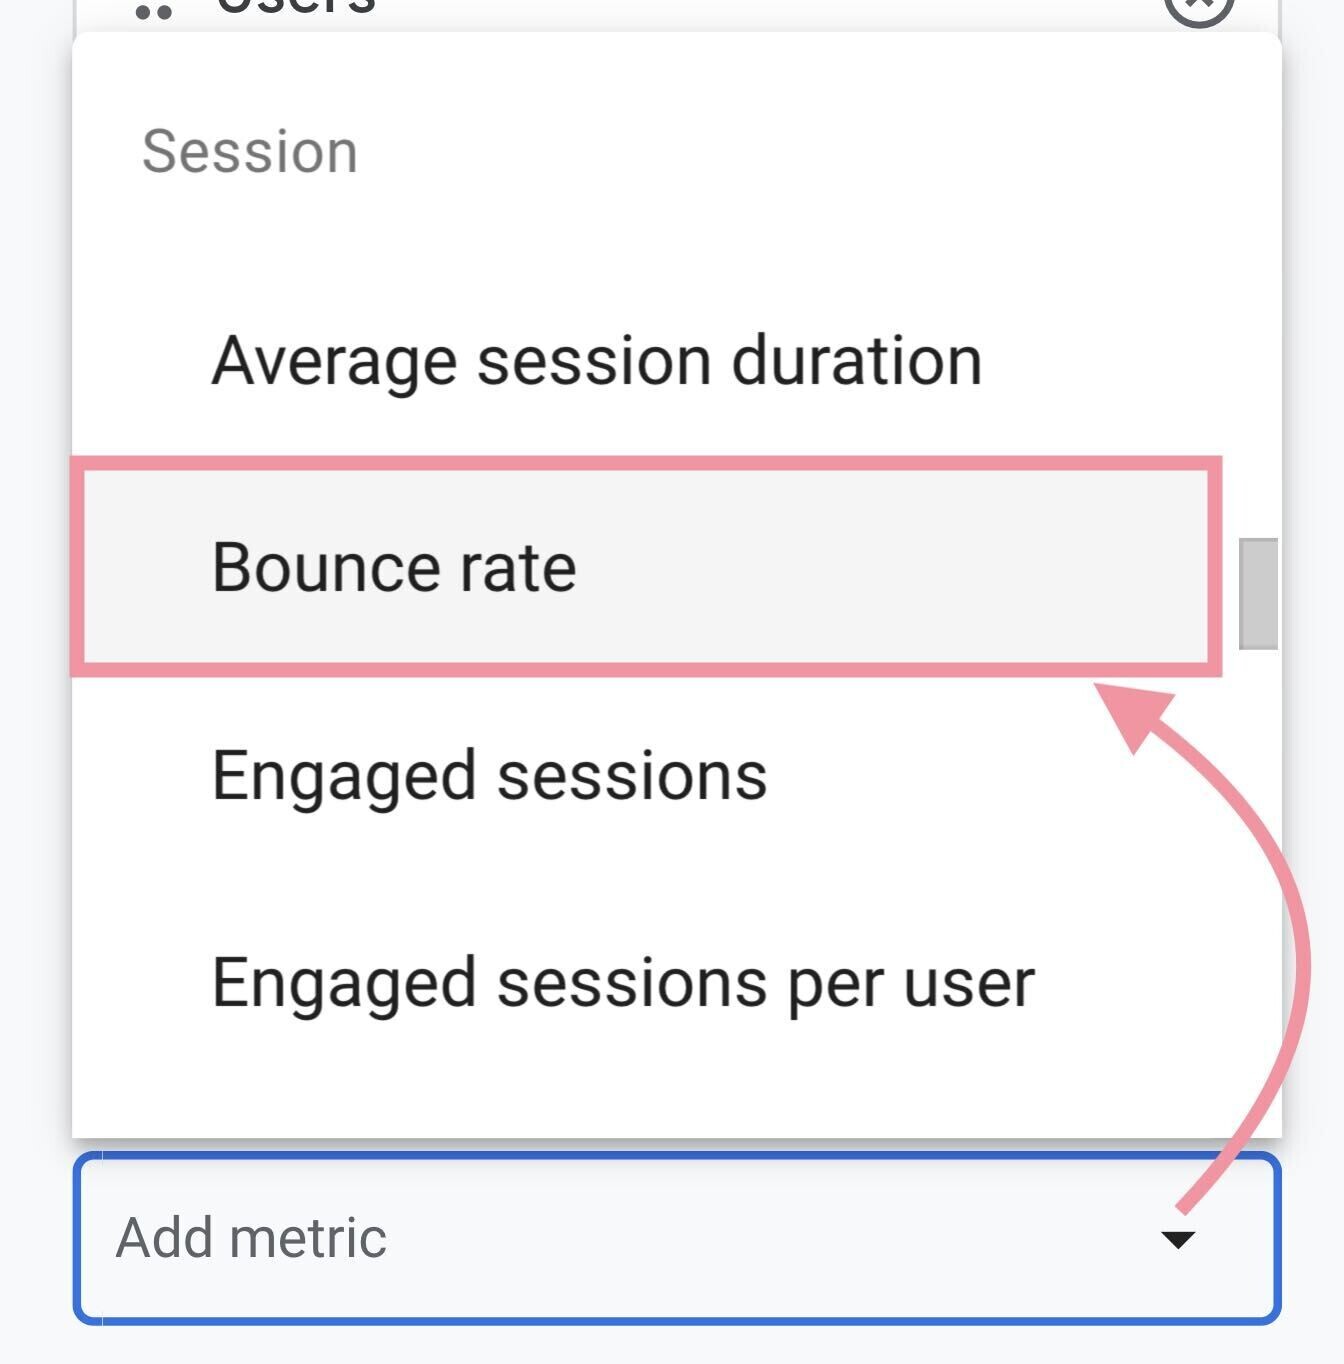
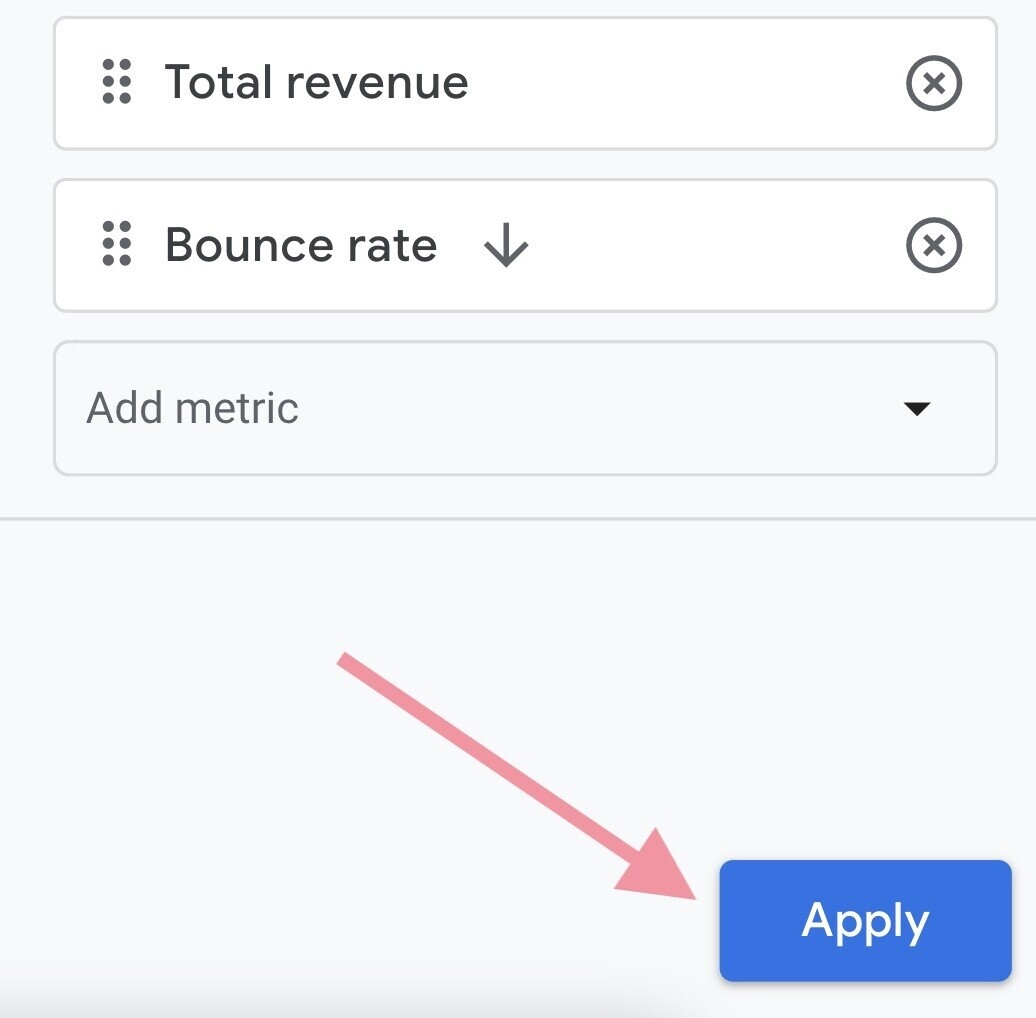
From the “Add metric” dropdown, choose “Bounce rate.”
And “Apply.”
You should now see bounce rate in your “Pages and screens” report.
7. Conversion Rate
A conversion rate tells you the percentage of users who have completed a desired action.
Like signing up on your website, purchasing your product, or subscribing to a newsletter.
By monitoring conversion rates, you can understand how well your campaigns are working. And identify non-converting pages so you can troubleshoot.
To begin tracking your conversion rate, you first need to create goals. Goals represent conversions that contribute to business success.
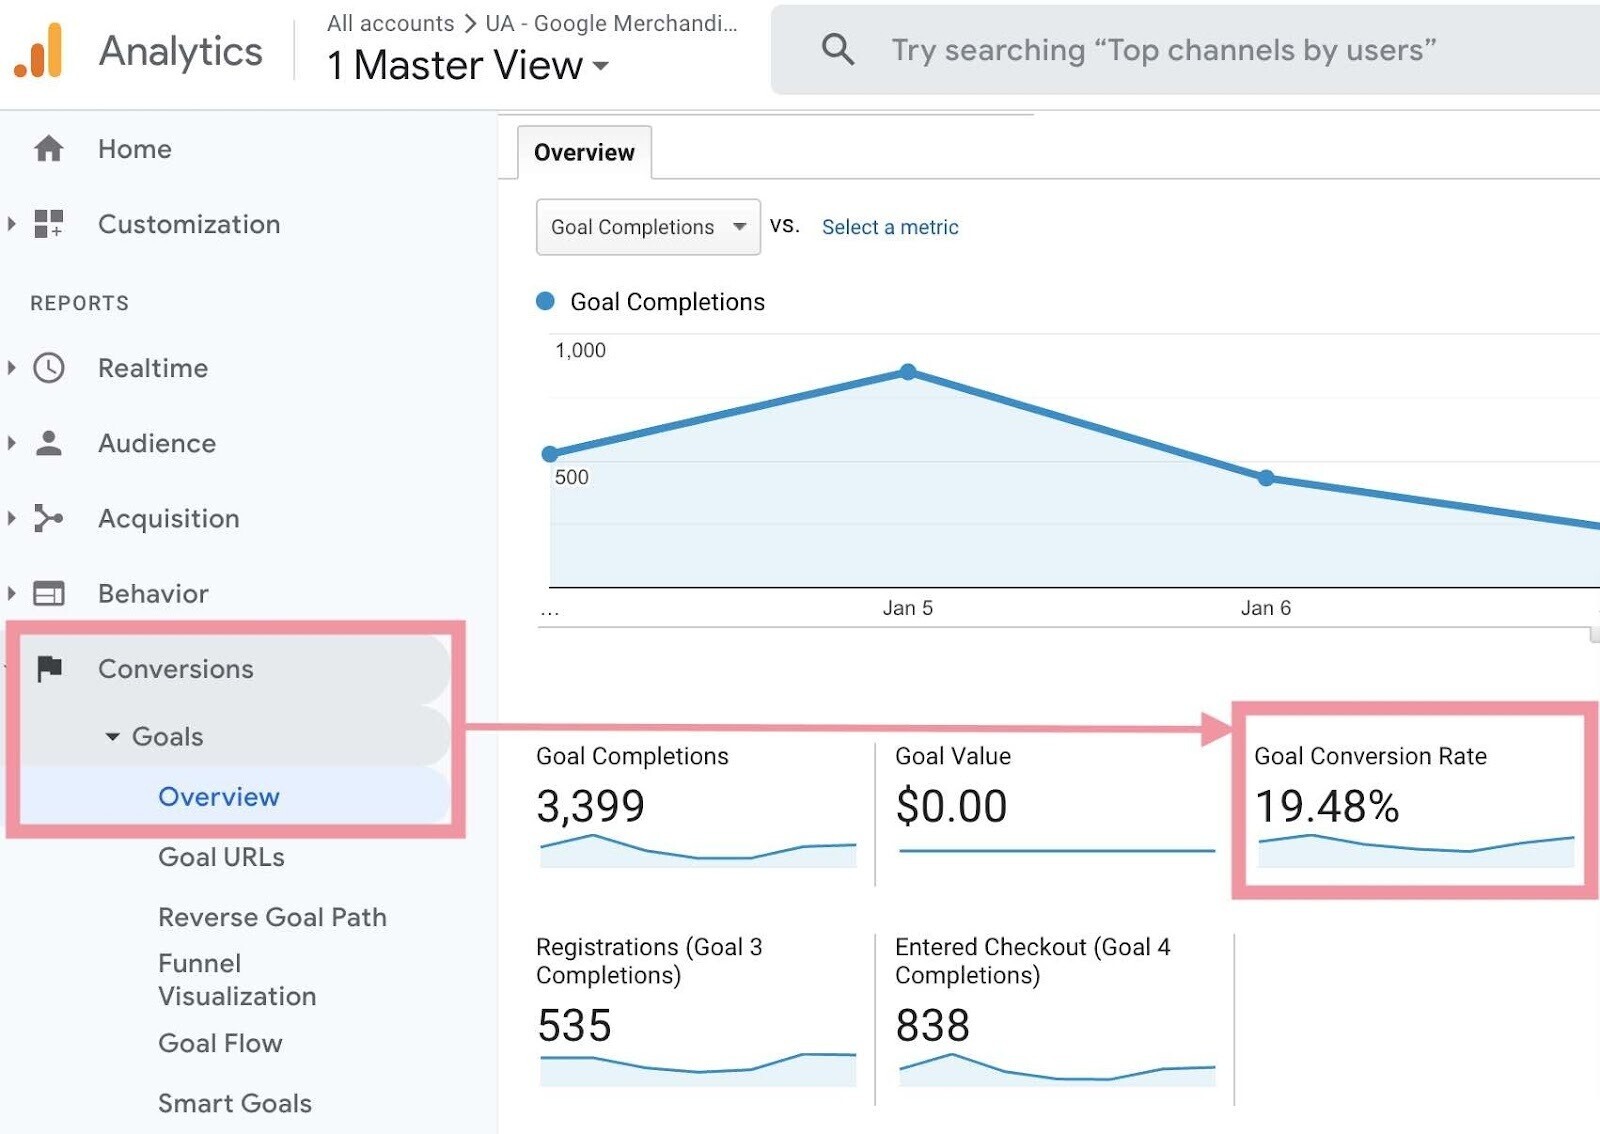
If you already set up goals, you can see your site’s conversion rate by going to “Conversions” > “Goals” > “Overview.”
To track conversion rate in GA4, you’ll first need to configure events.
That’s because GA4 is an event-based tool. Events let you measure user interactions (like loading a page, clicking a link, or making a purchase).
So for every action you want to measure the conversion rate for, you’ll create events.
After creating events, go to “Reports” > “Life cycle” > “Acquisition” > “Traffic acquisition.”
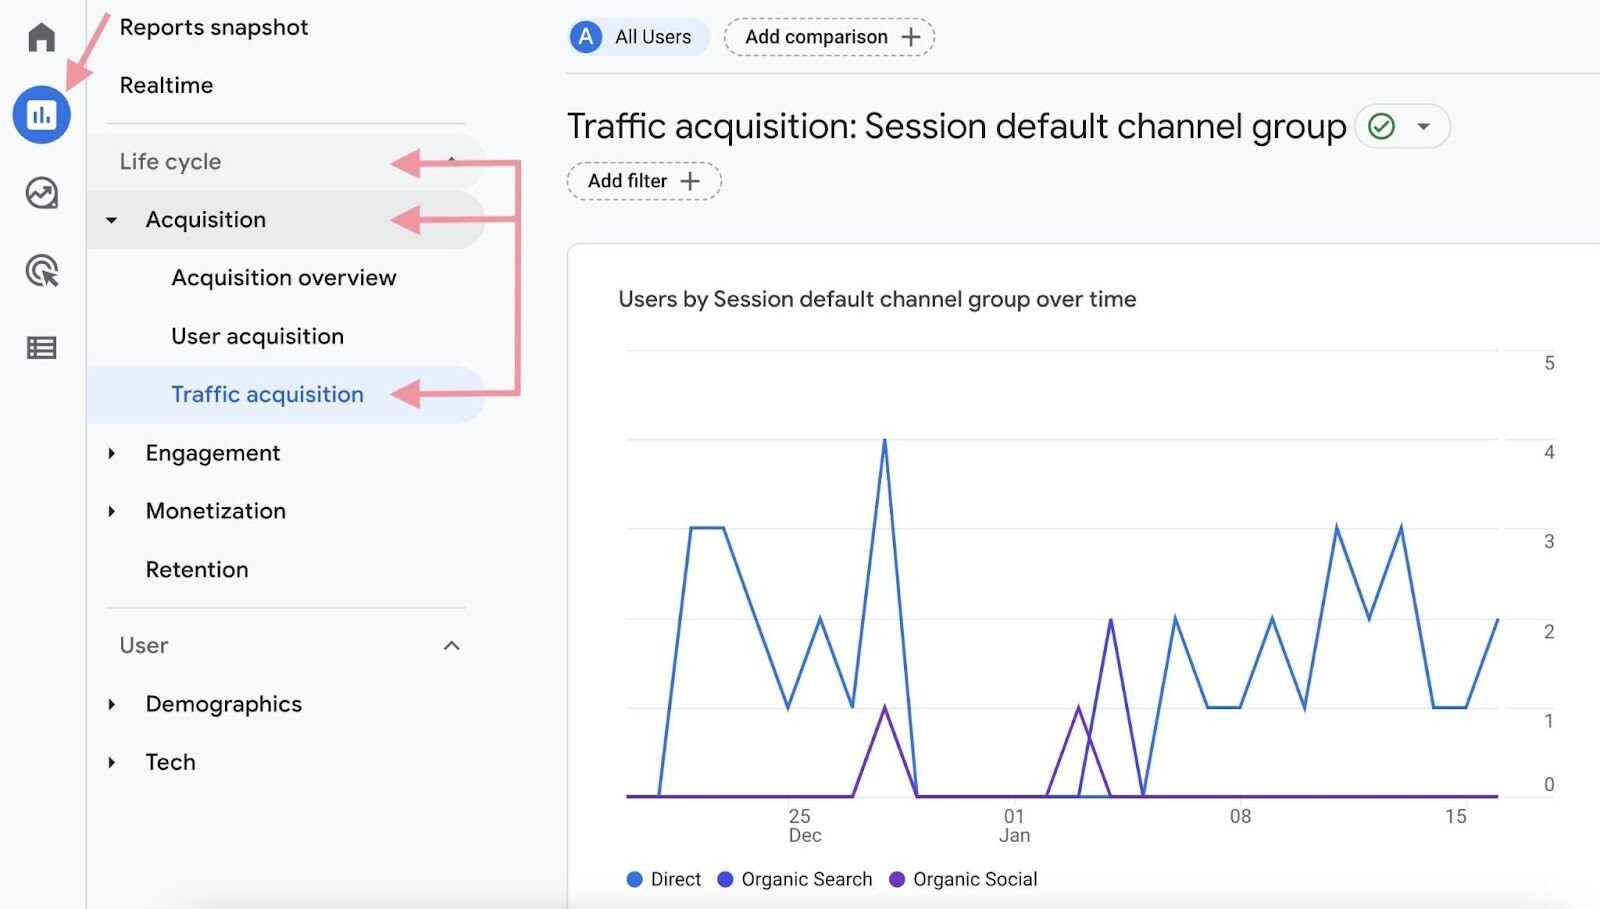
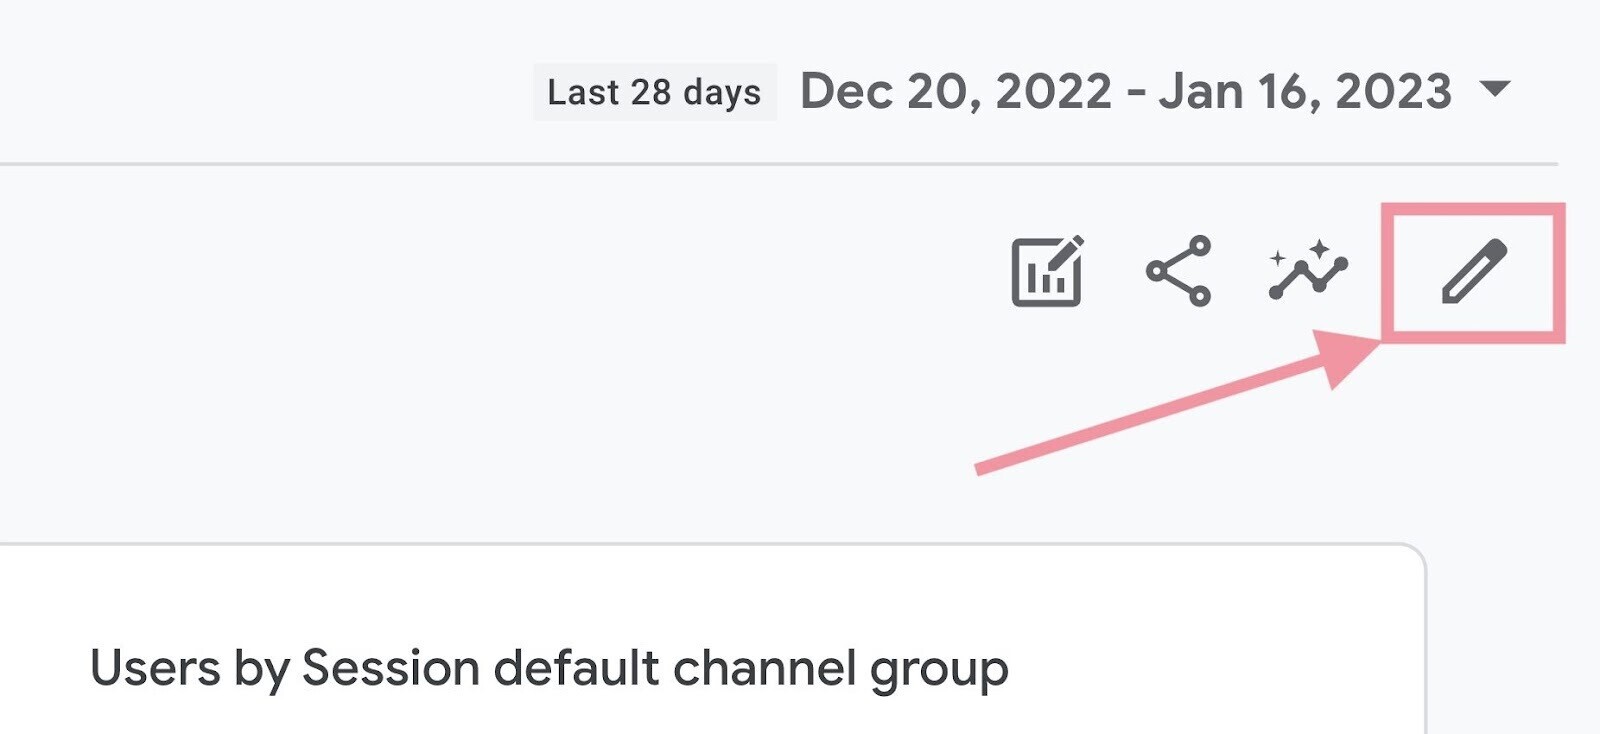
Then, find the pencil icon in the upper right corner.
Find “Metrics.”

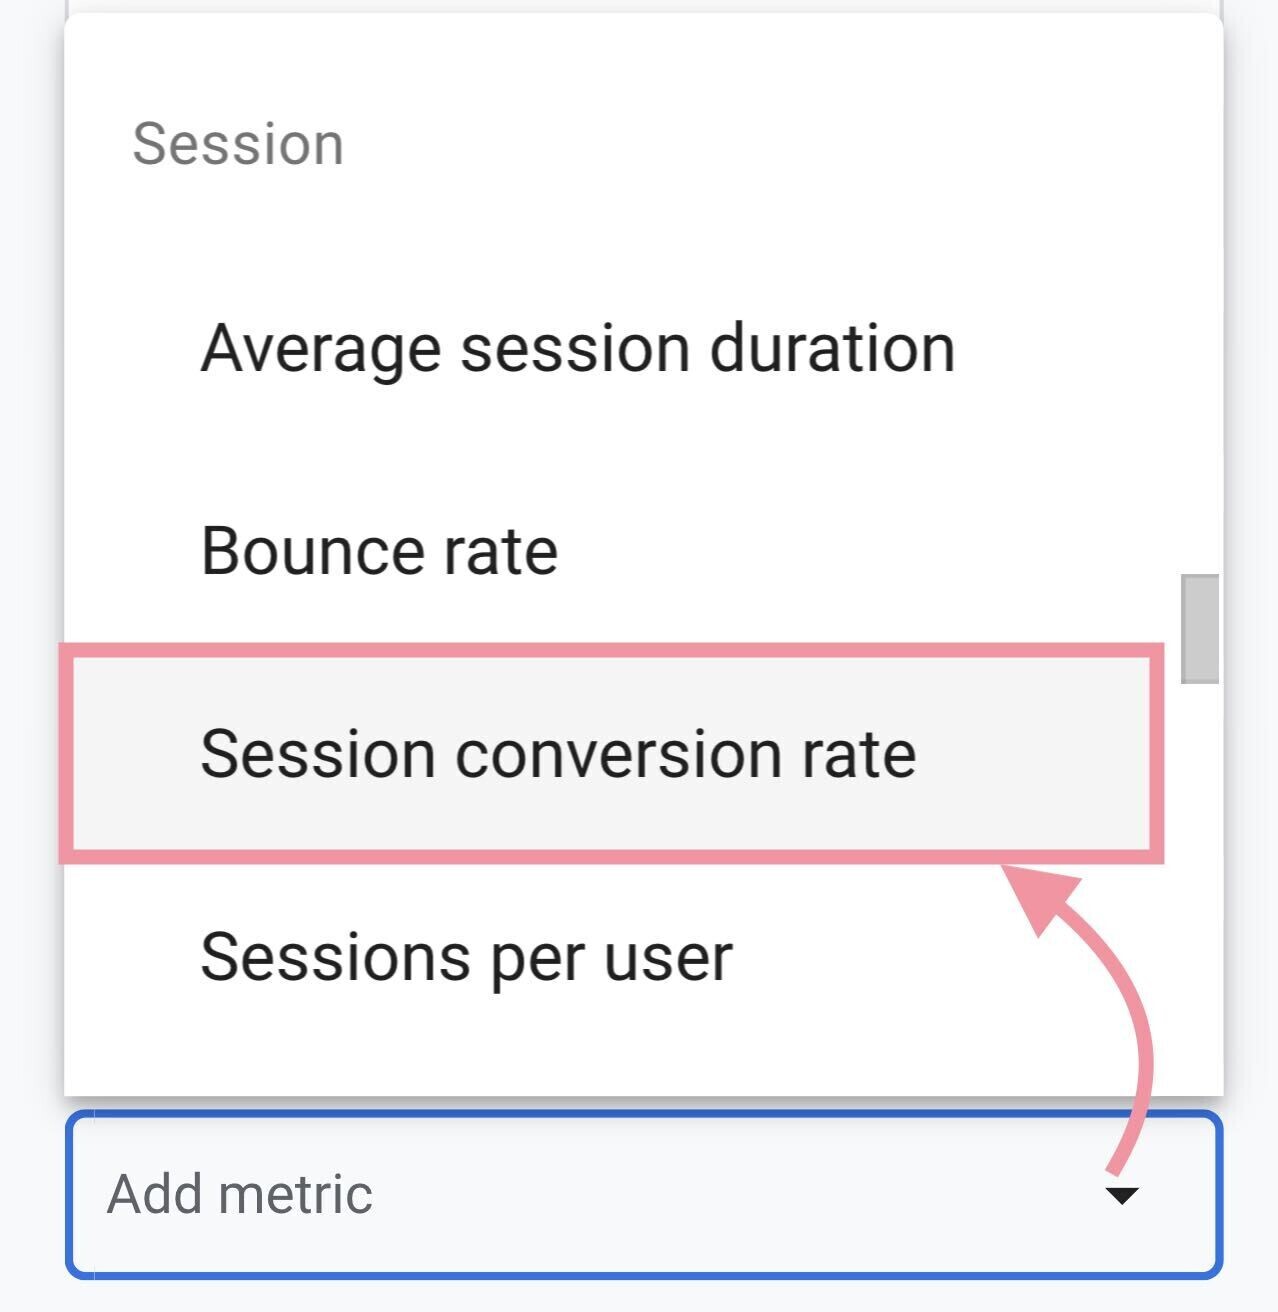
Then, “Add metric.” And look for “Session conversion rate.”
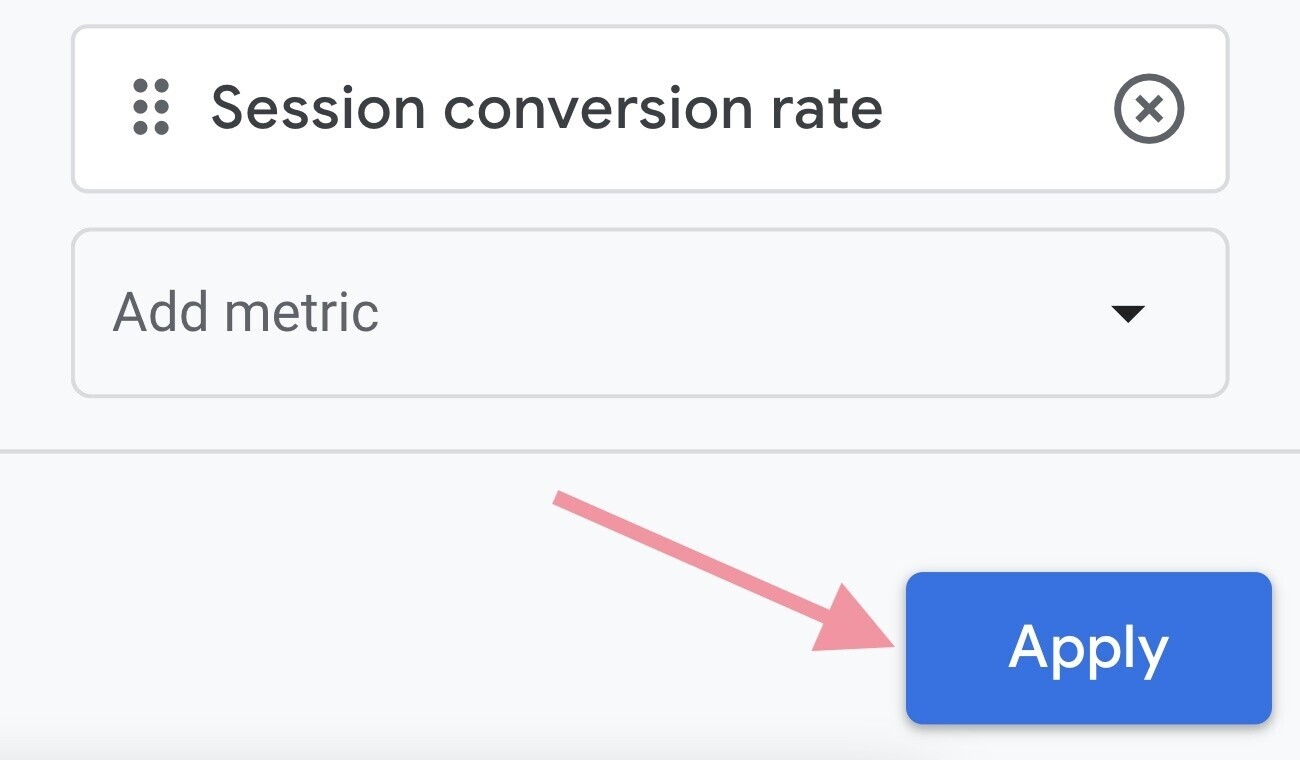
Then click “Apply.”
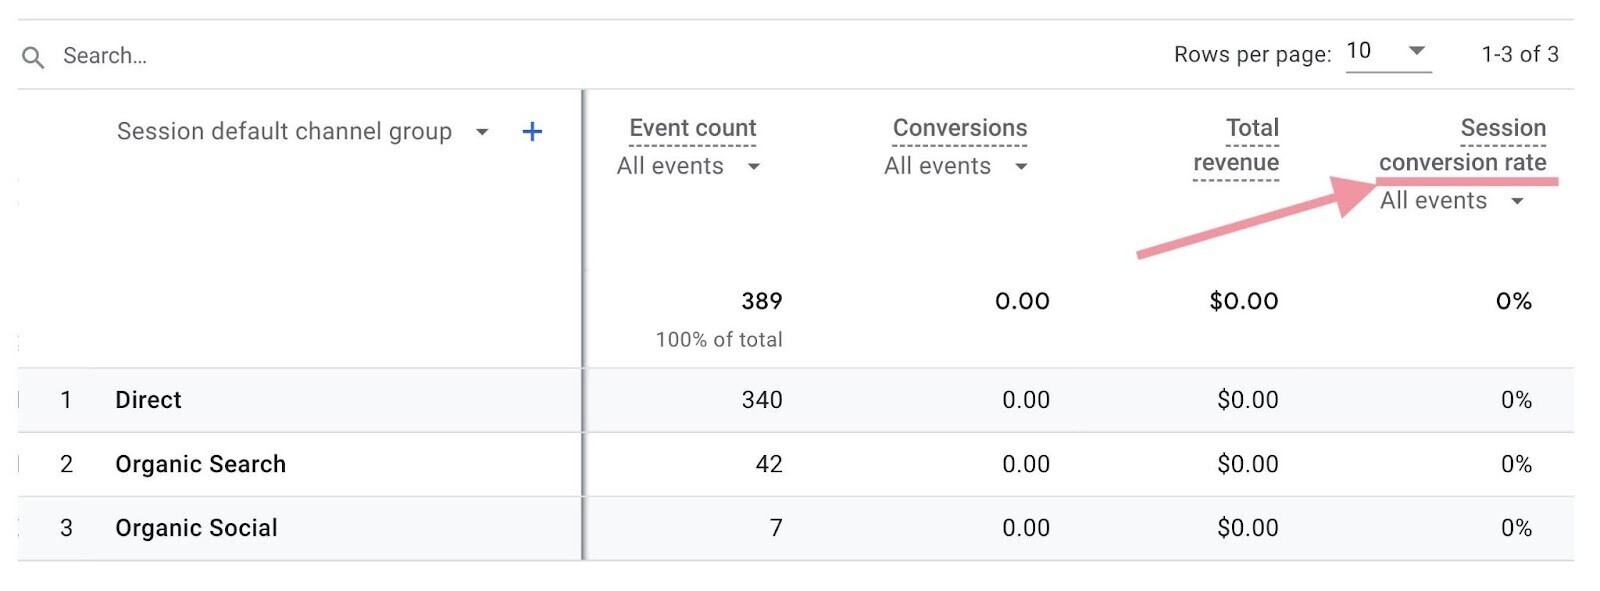
You should now see “Session conversion rate” in your “Traffic acquisition report.”
Which Metrics Should You Track?
Any Google Analytics metrics reporting you do should align with your business goals. This way, you can determine what’s going well and what you need to change.
Say you want to understand user engagement with your website. You might track average time on page, bounce rate, and pages per session.
But if you want to understand how your marketing campaign performed, you might track sessions and conversion rate.
If the metric isn’t of interest to you or a part of your business goals, it likely isn’t worth your time to track it. Over time, you’ll get a stronger feel for the metrics you actually care about.
Integrate Google Analytics with Semrush
To further analyze your website data, integrate your Google Analytics account with Semrush.
You can also connect your Google Search Console account. This way, you can view all your website’s data—including your Google Analytics metrics—from a central location. And get even more comprehensive data from Semrush tools.
Ready to learn more about analyzing your website? Read our beginner’s guide to Google Analytics.

