

Whether you are working as an in-house SEO or are agency-side, reports are something that we all have to produce. An SEO report helps to demonstrate the progress that a campaign is making, illustrates the ROI, and helps to justify why we took the approach that we did.
That said, SEOs usually want to spend time working on SEO strategy, not creating reports.
Our goal is to help you understand what a perfect SEO report should look like, what metrics to track, and how often to run your report.
This guide will cover:
- What Is an SEO Report?
- Why Should You Produce a Regular SEO Report?
- Choosing SEO Reporting Metrics and KPIs
- SEO Reporting Tools You Need
- Other Things You Can Include in an SEO Report
- An SEO Report Template You Can Use
What Is an SEO Report?
An SEO report is a summary of SEO metrics that illustrate how your site is performing. Reports typically cover areas like overall organic traffic, conversions, backlinks, and technical website health. However, you can customize the report for your goals.
SEO reporting is an effective way for you to communicate to stakeholders—usually your boss or your client—the impact that your SEO efforts are having upon their business.
But there is one problem—many SEO reports don’t actually tell the reader very much.
Pretty much any marketing manager or business owner is familiar with how to use Google Analytics to see their website’s stats. Sending a monthly report showing the traffic for the last 30 days along with any associated conversions isn’t enough.
Stakeholders deserve more, but at the same time, no one wants to read a 100+ page report that includes every metric under the sun. Many are completely meaningless in the context they are being presented.
An SEO report should show, at a bare minimum:
- What progress has been made?
- What activities have been undertaken and their impact?
- Recommendations to drive further growth.
In short: report the metrics that matter, communicate progress on predefined KPIs (key performance indicators), discuss what contributed to your success, troubleshoot what didn’t work, and highlight what you’ve accomplished vs. what you’ll do next.
Trust us when we say that great SEO reports help to create great relationships with others; they are worth investing the time to get right.
And our recent #Semrushchat on Twitter revealed some of the many challenges that SEOs face when it comes to reporting:
Great SEO reports help to create great relationships with others; they are worth investing the time to get right.
One of our previous #Semrushchat threads on on Twitter revealed some of the many challenges that SEOs face when it comes to reporting:
It is clear that we need better consistency in the way we report; this is something that many SEOs continue to struggle with.
Why Should You Produce a Regular SEO Report?
As we all know, SEO is a big deal for most businesses. It is a channel that is increasingly receiving more and more investment and attention. Even back in 2018, the global SEO industry was reported to be worth $80 billion.
There is a lot at stake.
Businesses are relying on the channel as a key marketing platform, and business owners, CFOs, and other primary stakeholders want to see a return on their investment.
For this reason, it is important that you are circulating regular SEO reports to provide progress updates. That said, SEO reports are equally as important to SEOs themselves, and absolutely shouldn’t be overlooked.
Get your SEO reporting right, and your job will be a lot easier. With the right report, you can quickly identify trends (both positive and negative), identify areas that need your attention, and see at a glance the insights that you need to do your job.
And when you choose the right metrics to report on, your reports become all the more valuable.

Choosing SEO Reporting Metrics and KPIs
You need to make sure that you are reporting on metrics that matter and these are often very different for different businesses. The metrics you choose to include should make it clear that reports are used as a way to communicate progress, success, and actions.
Report on too few metrics, and you won’t be giving a true picture. Report on too many, and anyone who reads it will likely lose interest.
The trick to successful SEO reporting is to clearly showcase the metrics that mean the most to the business and the project in question. The reporting needs of a local business for their local SEO strategy will be very different from an online store and their ecommerce SEO strategy.
Of course, there are many different tools that you can use to create SEO reports, and we have seen everything from spreadsheets and word documents to custom dashboards used to report on progress.
But, the reality is that to build better SEO reports, you can do so with just these tools:
And that is exactly what we are going to talk you through. We will look at how to use these tools to find great insights, choose the right metrics, and pull them together into a great report.
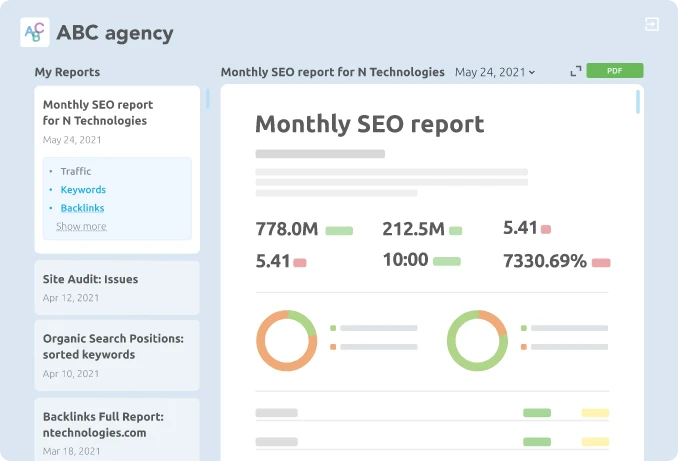
My Reports via Semrush
Semrush provides customizable reports that will streamline your reporting process. My Reports is useful because it allows you to blend the data on your performance while including Google Suite integrations with competitor data.
Custom Reports
You can build, manage, and share custom SEO reports in a few clicks with the Semrush My Reports tool. With drag-and-drop widgets, the tool allows you to easily access any data from dozens of Semrush tools and compile everything into a single PDF.
You can add data from Google Search Console, Google Analytics, Google Ads, Google My Business, and 40+ Semrush tools.
To align the report with your brand, you can add your logo, choose colors and themes, remove any mention of Semrush, and add any needed information. Branded reports are available to Agency Growth Kit users.

Report Automation
These reports can be automated to send regular reports to your boss or your clients. Reports can be sent on a daily, weekly, or monthly basis.
You can also set a custom reply-to address, add your signature, and save settings for future report exports.

White-label reports are available to Agency Growth Kit users.
Client Portal
With Semrush, you can take client SEO reporting to a new level.
You can create individual password-protected portals for your clients where they can access shared automated reports 24/7.
With the Client Portal, you only need to pick needed reports, set the update interval, and send portal credentials to your client. This will save you time preparing every single report.
This way, your clients can access SEO reports anytime they need them, which is quite helpful if your clients need to check their rankings daily or if they often require an update on the Site Audit report.
Check the Client Portal demo page, and see how it works for digital agencies and marketing teams. Password: 1234
Also, you can share all current tasks and important files with your client to be on the same page.
Client Portal is available to Agency Growth Kit users.
For detailed tips on using My Reports, visit this resource.
Reporting on Technical SEO
Technical SEO covers things like improving site speed, fixing broken links, resolving 404 errors, and more. This side of SEO relates to ensuring that your site can be properly indexed and crawled.
And from a reporting perspective, you should be reporting on the technical health of your site.
You should highlight key technical SEO errors and issues that need to be resolved, either to place into your activity workflow or to flag as a priority.
The Semrush Thematic Reports are a great place to start.

From within the Site Audit tool, you can view and export thematic reports that cover:
- Crawlability
- HTTPS
- International SEO
- Core Web Vitals
- Site Performance
- Internal Linking
- Markup
These issues are a great snapshot and provide an easy-to-understand summary of your site’s overall health and specific technical issues. You can find out more about the thematic reports here.
The snapshot you find on the main Site Audit dashboard is there for a reason. When you report to clients and managers, they often don’t need (or want) the complexities.
Present a CMO with a list of 404 errors, and you will get a blank stare. You may want to start off with a clean and easy-to-read summary — that is what the dashboard is there for.
Keeping things simple and showing a snapshot of overall technical health is often all that is needed, especially if your job is to communicate success. And hopefully, from a technical perspective, that success looks like very few technical errors.
You can export data from the Site Audit report straight into Google Data Studio at the top right.

Reporting on Keywords and Rankings
The SEO community is often torn when it comes to discussions on whether or not we should still report on keyword rankings in our SEO reports. Rankings have been a long-standing metric, and in some cases, it is hard to move away from using these as a metric of success.
At the end of the day, higher rankings should mean higher traffic and conversions; but it is often a bit more complex than that. If you rank for the wrong thing, those keywords won’t lead to conversions.
Either way, some clients will expect to see how their rankings increase, sometimes at a specific keyword level. There are different approaches you can take here, and the one that we recommend is to combine keyword rankings with a clear indication of overall organic visibility.
Let’s explore this in more depth and look at how you can get these metrics.
Keyword Rankings
When it comes to reporting on keyword rankings, the Position Tracking tool can make your job much easier.
If you have not yet set this up for your domain, go ahead and click “New Position Tracking.” You can either import your own keyword list manually, or you can import from a campaign, Semrush, or Google Analytics.
You then get a full picture of how these keywords are ranking. It is important to be able to show how rankings improve over time—not just as a snapshot.
Tracking keyword positions can show campaign progress in the early stages when perhaps a site isn’t generating much of an increase in organic traffic yet, but rankings are increasing.
They are what we like to call a soft metric, one that is a key indicator of progress, yet not a direct business impact on its own.
Average Position and Organic Keyword Visibility
It’s always useful to show trends in your reports. They are a great indicator of the progress that is being made.
When you report on individual keywords, you essentially show these in isolation. Still, you paint a better picture when you report using visibility growth, overall keyword trends, and average positions.
Again, you can use the Position Tracking report to see and report on all of these insights.
Let’s look at what you can use from this data and why it makes sense to use as metrics in your report:
Visibility helps showcase the overall trend of your site’s traffic potential, while the estimated traffic indicates how much traffic you should expect from organic search. Great as a snapshot, but this should be supplemented with Google Analytics data.
The interesting one here is average position, as this can be used to showcase how your site ranks on the SERPs across all keywords—a useful top-line metric.
But to really show impact, highlight the keywords and rankings distribution sections. They give a fantastic overview of how many keywords you have ranked in the different position buckets, and also how the distribution has changed over time.
Wherever possible, try to supplement snapshot metrics with trends and period to period changes, as this is typically the best way to demonstrate impact over time.
Reporting on Content Marketing
Many businesses are making big investments into content marketing right now, and they want to see an ROI. Common questions that we need to make sure our reports are answering around content marketing include things like:
- Which pages are being viewed the most?
- Which pages are being landed on the most from SEO?
- Are there any content gaps with our competitors that we still need to close?
So let’s take a look at how you can find these.
Highest Pageviews
It’s important to understand which pages on your site receive the highest number of pageviews from organic search. These are your most popular pages, and you need to focus on ensuring that traffic converts.
But aside from this, it’s useful for stakeholders to see which the most popular pages on a site are—this information can offer insights for an upcoming product or service development, or show a clear indication that the right pages are being seen.
Head to Google Analytics and to Behavior > Site Content > All Pages.
- Here you see (for the timeframe you have set) the pages with the highest pageviews
- Be sure to filter to only show organic traffic if you don’t want other channels to distort your data

We recommend showing the top 25, at least.

Pro tip: Google Analytics offers a simple and effective integration straight into Google Data Studio.
Landing Pages
The average landing page conversion rate across all industries is 9.7%, so it’s wise to spend time carefully crafting your landing page for your audience.
To report on landing pages, first find which pages on your site are performing the best from an organic traffic acquisition perspective.
Head to Google Analytics and to Behavior > Site Content > Landing Pages.
As above, be sure to filter by organic traffic.

Reporting on Link Building
Links remain a key ranking factor, and there is a very strong chance that pretty much any SEO report is going to need to report on links. But what specific link metrics should you be reporting on for your client and key stakeholders? Let’s find out.
The Links You Have Built
It always pays to be transparent. If you are building links in the right way, you should have nothing to hide. One of the biggest hesitations from clients engaging an SEO supplier is that they are concerned about the quality of links that will be built.
So use your report to demonstrate the great quality and the great links you have been working on.
We typically find that importing a list of all of the links you have built in that period from a Google Sheets file into Google Data Studio, alongside the Authority Score (AS), and the target page goes down well.
You should also include a running total of the number of links you have built, and the average AS since you began working.
Link Profile Breakdown
Head to the Backlink Analytics tool, and you will see a snapshot of your domain’s links profile. Using this overview is perhaps the most effective way to report on the profile’s overall health.
It is easy to understand, yet detailed enough that it covers:
- The most common categories of linking domains
- An anchor text cloud (important so that you can ensure there is no spike of a commercial anchor text that could be harmful)
- Referring domains by AS
- Link profile size over time
- A nofollow vs. followed breakdown
In short, if you want to present a link profile snapshot, there couldn’t be a better way to do it. Of course, you can also import this straight into Google Data Studio.

New and Lost Links
You can see your new and lost links (and referring domains) as part of the above report, but it warrants mentioning on its own. The real goal is to see growth in link profile size and quality over time, but the simple nature of the tactic is that links do drop off from time to time.
Be transparent and highlight any areas you have lost links from and analyze these in more detail, giving you an opportunity to reach out and reclaim the link if possible.
Link Profile Growth Over Time
Again, this is available as part of the Backlink Analytics, but important to reference on its own. In most cases, you will find that you have a link gap with main competitors; this is normal and part of the reason why you need to be building links.
One surefire way to show progress through your link building efforts is to show how, specifically, the number of referring domains is increasing over time.
Be sure to clearly highlight this in your reports to show how your efforts are paying off.
Link Profile Health (Toxic Link Score)
Reporting on the health of your link profile is essential yet often overlooked.
From bad practices undertaken by a previous SEO to a negative SEO attack, your site can end up with toxic links pointing to your site for many different reasons. And again, transparency is the best approach here.
Using a snapshot from the Backlink Audit tool is a great inclusion in reports. It provides an opportunity to portray the (hopefully) low toxicity of links that point to your site, as well as highlight your plan of action to disavow or remove any that are deemed toxic or potentially toxic.

Reporting on Local SEO
If you are running a local business, you should be familiar with Google Business Profile (formerly Google My Business). It’s an important platform for any business that has a physical presence or serves customers at their own addresses.
As SEOs, you need to report on this platform; this is the main addition you want to add to your reports when you are working on local SEO.
By default, you can’t integrate Google Business Profile with Data Studio, but with the use of a connector, you can do just that.

Which Metrics Are Important to Report on for Local SEO?
As a start, we recommend:
- Impressions
- Views
- Total Actions
- Photo Views (Merchants)
- Post Views
- Reviews
- Average Review Rating
These are all key metrics that matter to local businesses; show the progress of your campaign, and create talking points. If you want to layer more insights into a dedicated local SEO report, take a look at our guide of advanced local SEO reporting techniques.
Reporting on Conversions
Conversions are the lifeblood of any business, and in many ways, are the main KPI of any SEO campaign.
At the end of the day, we run SEO campaigns to increase website traffic and associated conversions to generate leads or make sales—meaning that these are the end goal.
We should be reporting on conversions. Otherwise, we are really only reporting on part of the picture.
Investments are made on the prospect of financial return. You know what they say—rankings are vanity, conversions are sanity. It’s absolutely essential that your SEO reports show these end goal metrics clearly.
Hopefully, by this stage, you have had a conversation with your client or boss about the conversions that matter, so be sure to include them.
Don’t Group Different Types of Conversions
Don’t be tempted to group different conversions together to show “all conversions.” This is meaningless and often frustrates those who read a report. If you make take bookings on your site but also receive form inquiries, you should have two different sections for them in your report.
The most effective way to import conversions into your report is from Google Analytics, importing either goal conversions or ecommerce transactions (or both, if needed).
You can learn how to do this in more detail here.
Other Things You Can Include in an SEO Report
Aside from reporting on key metrics, we always recommend that you include a couple of summary slides in your SEO reports.
As a bare minimum, these should be:
Activities Completed This Month
What did you do this month? This your chance to clearly demonstrate where the resources you were given were used.
Next Month’s Plan
Here you can showcase what you will be working on next month. Again, this sets the scene for the activities you will be undertaking over the next 30 days and sets expectations clearly; this is really important for effective communication, yet is often forgotten.
Professional Summary
A report on its own is just numbers and graphs. You need to make sure you are adding context by putting in your professional summary.
- Have things gone well? Say what has contributed to that.
- Things not gone so well? Similarly, explain the issues.
Including a one pager like this can go a long way in communicating progress at a wider level, and can help set the scene for monthly catch up calls.
An SEO Report Template You Can Use
You now know the main metrics you should be reporting to your clients or boss, but how do you turn this into an actual report?
Now, the first thing to understand is that reports should almost always be custom to the client or business you are working for. Every business has its own requirements and specific metrics that matter, and you need to communicate effectively by using them.
That said, you need a starting point. A good approach is using Google Data Studio or a seamless report like Semrush’s My Reports feature.
You may have been used to presenting your clients with static snapshot reports, PDFs, Word documents, spreadsheets—usually at the end of every month, but as we have already said, clients deserve more.
Google Data Studio allows you to build dashboards that are updated in real-time.
Gone are the days of static reports, and we strongly believe that in 2020, you need to be providing reports that allow your clients or boss to check in on progress at any time.
And that is what we will ultimately work towards here, after taking a deep-dive into some of the metrics that you could include in your reports.
Let’s walk through where to grab report insights that you might need outside of a data studio environment, as well.
We launched our own Google Data Studio SEO template to help make setting up awesome reports a bit easier.

This is a great starting point as well as a great way to become familiar with GDS if you have not used it before. This template is the perfect way to build the starting point of a great reporting dashboard that you can build on and continue to customize to your own needs.
And if you are looking to take your Data Studio skills to the next level, here are some awesome resources that we recommend you take the time to look over and learn from:
Dive in and have a play around; once you have got the hang of GDS, you will learn to love it and realize there are so many ways it can take your reporting to the next level.
There we go, a practical guide to producing better SEO reports using metrics that really matter.
Be sure to remember your reporting’s core purpose—communicating success and progress—and can’t go far wrong.
Lastly, don’t include metrics for the sake of it. Always have a conversation with clients or stakeholders in your business to find out how you can make their jobs easier with the reports you send.